Zip Codes with the Highest Percentage of Population Employed in Installation, Maintenance & Repair in Hammond, LA
RELATED REPORTS & OPTIONS
Installation, Maintenance & Repair
Hammond
Compare Zip Codes
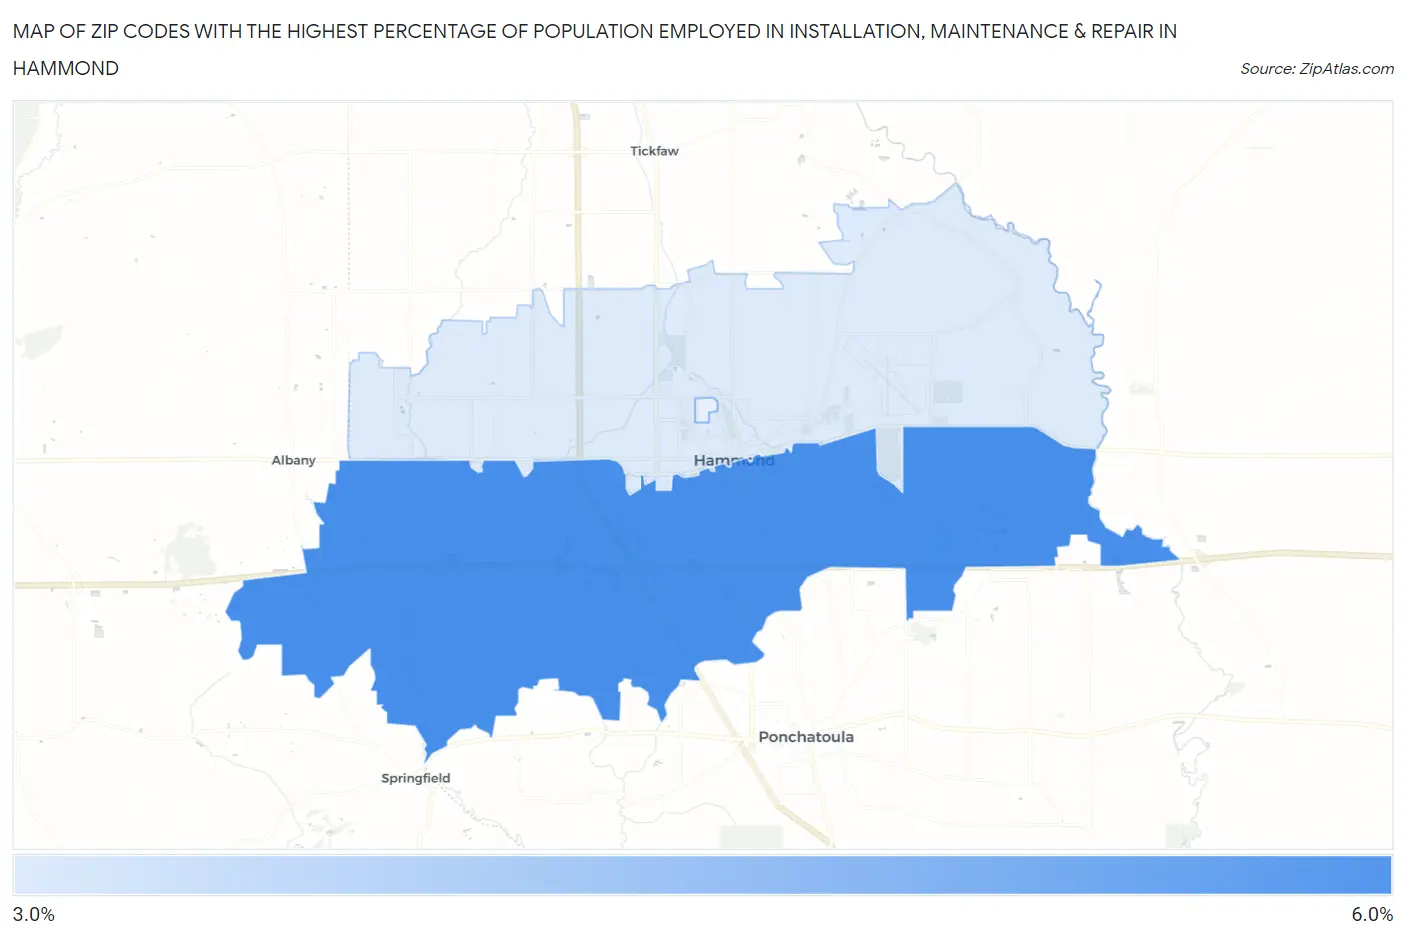
Map of Zip Codes with the Highest Percentage of Population Employed in Installation, Maintenance & Repair in Hammond
3.6%
6.0%
Zip Codes with the Highest Percentage of Population Employed in Installation, Maintenance & Repair in Hammond, LA
| Zip Code | % Employed | vs State | vs National | |
| 1. | 70403 | 6.0% | 3.7%(+2.27)#122 | 3.1%(+2.89)#6,239 |
| 2. | 70401 | 3.6% | 3.7%(-0.041)#267 | 3.1%(+0.571)#13,986 |
1
Common Questions
What are the Top Zip Codes with the Highest Percentage of Population Employed in Installation, Maintenance & Repair in Hammond, LA?
Top Zip Codes with the Highest Percentage of Population Employed in Installation, Maintenance & Repair in Hammond, LA are:
What zip code has the Highest Percentage of Population Employed in Installation, Maintenance & Repair in Hammond, LA?
70403 has the Highest Percentage of Population Employed in Installation, Maintenance & Repair in Hammond, LA with 6.0%.
What is the Percentage of Population Employed in Installation, Maintenance & Repair in Hammond, LA?
Percentage of Population Employed in Installation, Maintenance & Repair in Hammond is 2.2%.
What is the Percentage of Population Employed in Installation, Maintenance & Repair in Louisiana?
Percentage of Population Employed in Installation, Maintenance & Repair in Louisiana is 3.7%.
What is the Percentage of Population Employed in Installation, Maintenance & Repair in the United States?
Percentage of Population Employed in Installation, Maintenance & Repair in the United States is 3.1%.