Zip Codes with the Highest Percentage of Population Employed in Office & Administration in Hammond, LA
RELATED REPORTS & OPTIONS
Office & Administration
Hammond
Compare Zip Codes
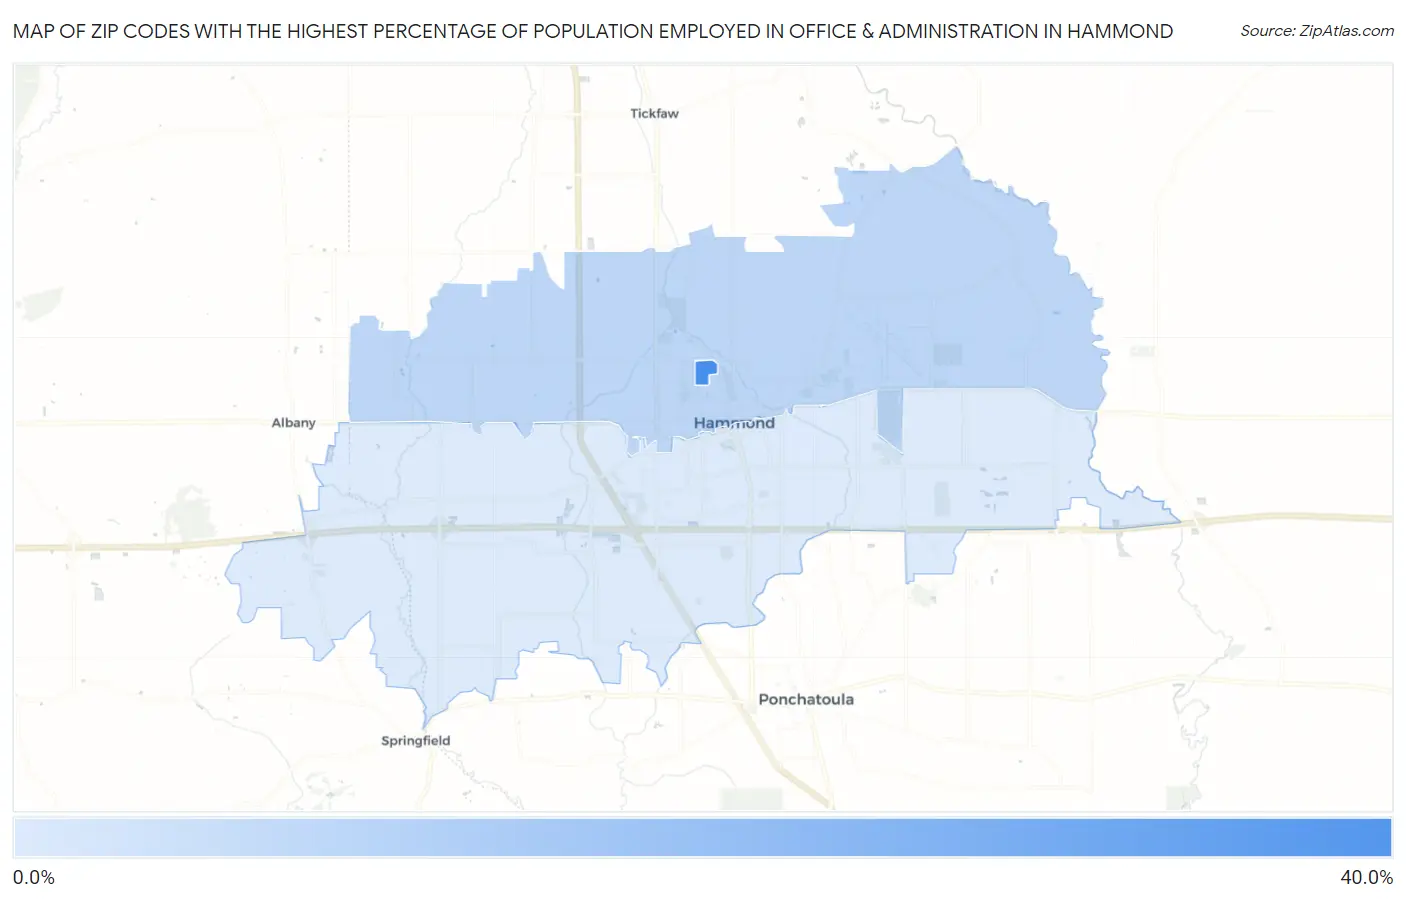
Map of Zip Codes with the Highest Percentage of Population Employed in Office & Administration in Hammond
5.8%
37.3%
Zip Codes with the Highest Percentage of Population Employed in Office & Administration in Hammond, LA
| Zip Code | % Employed | vs State | vs National | |
| 1. | 70402 | 37.3% | 10.6%(+26.7)#13 | 10.9%(+26.4)#323 |
| 2. | 70401 | 12.1% | 10.6%(+1.46)#167 | 10.9%(+1.20)#10,540 |
| 3. | 70403 | 5.8% | 10.6%(-4.80)#412 | 10.9%(-5.06)#27,138 |
1
Common Questions
What are the Top Zip Codes with the Highest Percentage of Population Employed in Office & Administration in Hammond, LA?
Top Zip Codes with the Highest Percentage of Population Employed in Office & Administration in Hammond, LA are:
What zip code has the Highest Percentage of Population Employed in Office & Administration in Hammond, LA?
70402 has the Highest Percentage of Population Employed in Office & Administration in Hammond, LA with 37.3%.
What is the Percentage of Population Employed in Office & Administration in Hammond, LA?
Percentage of Population Employed in Office & Administration in Hammond is 9.2%.
What is the Percentage of Population Employed in Office & Administration in Louisiana?
Percentage of Population Employed in Office & Administration in Louisiana is 10.6%.
What is the Percentage of Population Employed in Office & Administration in the United States?
Percentage of Population Employed in Office & Administration in the United States is 10.9%.