Zip Codes with the Lowest Percentage of Renter-Occupied Units in Hammond, LA
RELATED REPORTS & OPTIONS
Lowest Renter-Occupied
Hammond
Compare Zip Codes
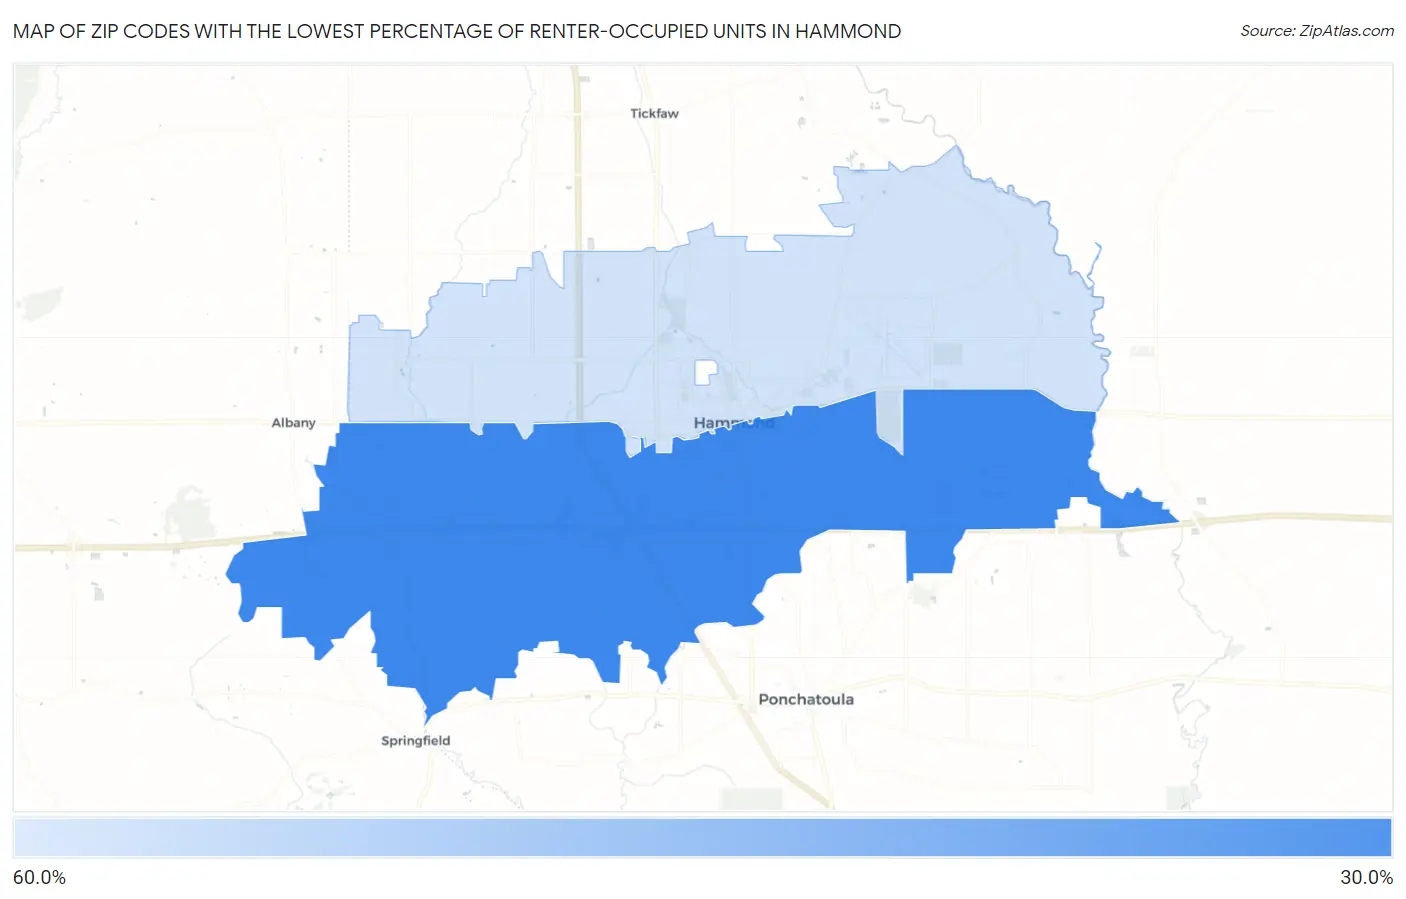
Map of Zip Codes with the Lowest Percentage of Renter-Occupied Units in Hammond
51.1%
30.1%
Zip Codes with the Lowest Percentage of Renter-Occupied Units in Hammond, LA
| Zip Code | % Renter-Occupied | vs State | vs National | |
| 1. | 70403 | 30.1% | 32.8%(-2.71)#314 | 35.2%(-5.06)#21,125 |
| 2. | 70401 | 51.1% | 32.8%(+18.2)#439 | 35.2%(+15.9)#28,182 |
1
Common Questions
What are the Top Zip Codes with the Lowest Percentage of Renter-Occupied Units in Hammond, LA?
Top Zip Codes with the Lowest Percentage of Renter-Occupied Units in Hammond, LA are:
What zip code has the Lowest Percentage of Renter-Occupied Units in Hammond, LA?
70403 has the Lowest Percentage of Renter-Occupied Units in Hammond, LA with 30.1%.
What is the Percentage of Renter-Occupied Units in Hammond, LA?
Percentage of Renter-Occupied Units in Hammond is 51.0%.
What is the Percentage of Renter-Occupied Units in Louisiana?
Percentage of Renter-Occupied Units in Louisiana is 32.8%.
What is the Percentage of Renter-Occupied Units in the United States?
Percentage of Renter-Occupied Units in the United States is 35.2%.