Lithuanian vs Sierra Leonean Median Earnings
COMPARE
Lithuanian
Sierra Leonean
Median Earnings
Median Earnings Comparison
Lithuanians
Sierra Leoneans
$50,991
MEDIAN EARNINGS
99.8/ 100
METRIC RATING
70th/ 347
METRIC RANK
$48,286
MEDIAN EARNINGS
93.1/ 100
METRIC RATING
127th/ 347
METRIC RANK
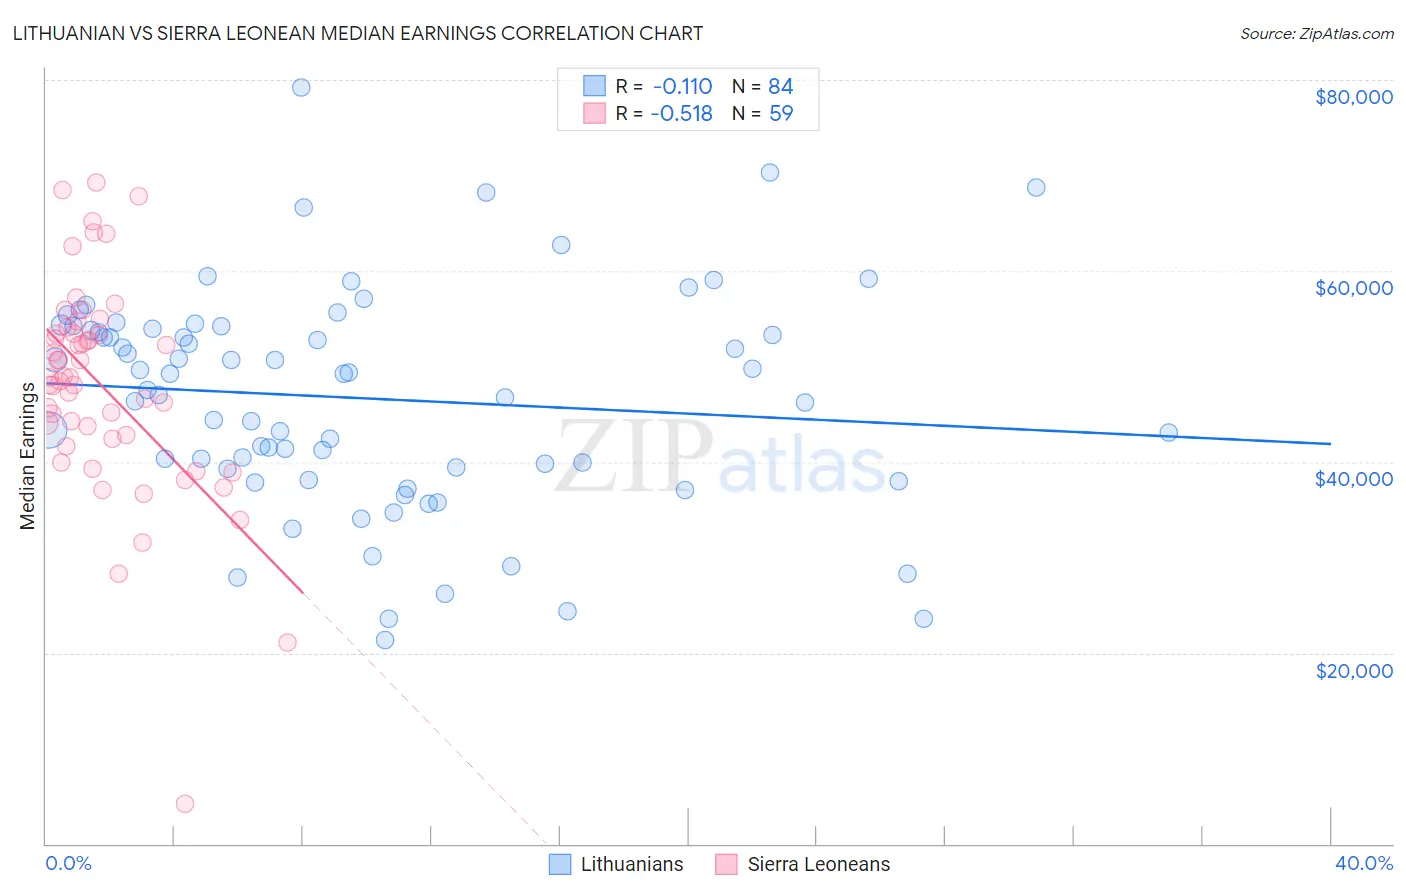
Lithuanian vs Sierra Leonean Median Earnings Correlation Chart
The statistical analysis conducted on geographies consisting of 421,906,288 people shows a poor negative correlation between the proportion of Lithuanians and median earnings in the United States with a correlation coefficient (R) of -0.110 and weighted average of $50,991. Similarly, the statistical analysis conducted on geographies consisting of 83,350,653 people shows a substantial negative correlation between the proportion of Sierra Leoneans and median earnings in the United States with a correlation coefficient (R) of -0.518 and weighted average of $48,286, a difference of 5.6%.
Median Earnings Correlation Summary
| Measurement | Lithuanian | Sierra Leonean |
| Minimum | $21,331 | $4,235 |
| Maximum | $79,217 | $69,241 |
| Range | $57,886 | $65,006 |
| Mean | $46,654 | $47,947 |
| Median | $48,402 | $48,865 |
| Interquartile 25% (IQ1) | $39,359 | $42,439 |
| Interquartile 75% (IQ3) | $54,080 | $53,466 |
| Interquartile Range (IQR) | $14,721 | $11,027 |
| Standard Deviation (Sample) | $11,467 | $11,282 |
| Standard Deviation (Population) | $11,398 | $11,186 |
Similar Demographics by Median Earnings
Demographics Similar to Lithuanians by Median Earnings
In terms of median earnings, the demographic groups most similar to Lithuanians are Immigrants from Ukraine ($50,984, a difference of 0.010%), Mongolian ($51,038, a difference of 0.090%), Paraguayan ($51,068, a difference of 0.15%), Immigrants from Egypt ($50,901, a difference of 0.18%), and Immigrants from Spain ($51,092, a difference of 0.20%).
| Demographics | Rating | Rank | Median Earnings |
| Immigrants | Bulgaria | 99.9 /100 | #63 | Exceptional $51,318 |
| New Zealanders | 99.9 /100 | #64 | Exceptional $51,246 |
| Greeks | 99.9 /100 | #65 | Exceptional $51,164 |
| Afghans | 99.9 /100 | #66 | Exceptional $51,112 |
| Immigrants | Spain | 99.9 /100 | #67 | Exceptional $51,092 |
| Paraguayans | 99.9 /100 | #68 | Exceptional $51,068 |
| Mongolians | 99.8 /100 | #69 | Exceptional $51,038 |
| Lithuanians | 99.8 /100 | #70 | Exceptional $50,991 |
| Immigrants | Ukraine | 99.8 /100 | #71 | Exceptional $50,984 |
| Immigrants | Egypt | 99.8 /100 | #72 | Exceptional $50,901 |
| Immigrants | Netherlands | 99.8 /100 | #73 | Exceptional $50,818 |
| South Africans | 99.8 /100 | #74 | Exceptional $50,752 |
| Immigrants | Scotland | 99.8 /100 | #75 | Exceptional $50,741 |
| Immigrants | Italy | 99.7 /100 | #76 | Exceptional $50,581 |
| Immigrants | Western Europe | 99.7 /100 | #77 | Exceptional $50,549 |
Demographics Similar to Sierra Leoneans by Median Earnings
In terms of median earnings, the demographic groups most similar to Sierra Leoneans are Immigrants from Fiji ($48,305, a difference of 0.040%), Assyrian/Chaldean/Syriac ($48,304, a difference of 0.040%), Immigrants from Philippines ($48,266, a difference of 0.040%), Pakistani ($48,254, a difference of 0.070%), and Zimbabwean ($48,229, a difference of 0.12%).
| Demographics | Rating | Rank | Median Earnings |
| Carpatho Rusyns | 95.5 /100 | #120 | Exceptional $48,617 |
| Arabs | 95.4 /100 | #121 | Exceptional $48,599 |
| Chileans | 94.8 /100 | #122 | Exceptional $48,504 |
| Immigrants | Syria | 93.9 /100 | #123 | Exceptional $48,375 |
| Brazilians | 93.7 /100 | #124 | Exceptional $48,356 |
| Immigrants | Fiji | 93.3 /100 | #125 | Exceptional $48,305 |
| Assyrians/Chaldeans/Syriacs | 93.3 /100 | #126 | Exceptional $48,304 |
| Sierra Leoneans | 93.1 /100 | #127 | Exceptional $48,286 |
| Immigrants | Philippines | 92.9 /100 | #128 | Exceptional $48,266 |
| Pakistanis | 92.8 /100 | #129 | Exceptional $48,254 |
| Zimbabweans | 92.6 /100 | #130 | Exceptional $48,229 |
| Lebanese | 92.5 /100 | #131 | Exceptional $48,226 |
| British | 92.2 /100 | #132 | Exceptional $48,189 |
| Immigrants | Uganda | 90.5 /100 | #133 | Exceptional $48,041 |
| Sri Lankans | 90.5 /100 | #134 | Exceptional $48,040 |