Immigrants from Guatemala vs Bahamian Median Earnings
COMPARE
Immigrants from Guatemala
Bahamian
Median Earnings
Median Earnings Comparison
Immigrants from Guatemala
Bahamians
$40,851
MEDIAN EARNINGS
0.0/ 100
METRIC RATING
304th/ 347
METRIC RANK
$39,735
MEDIAN EARNINGS
0.0/ 100
METRIC RATING
323rd/ 347
METRIC RANK
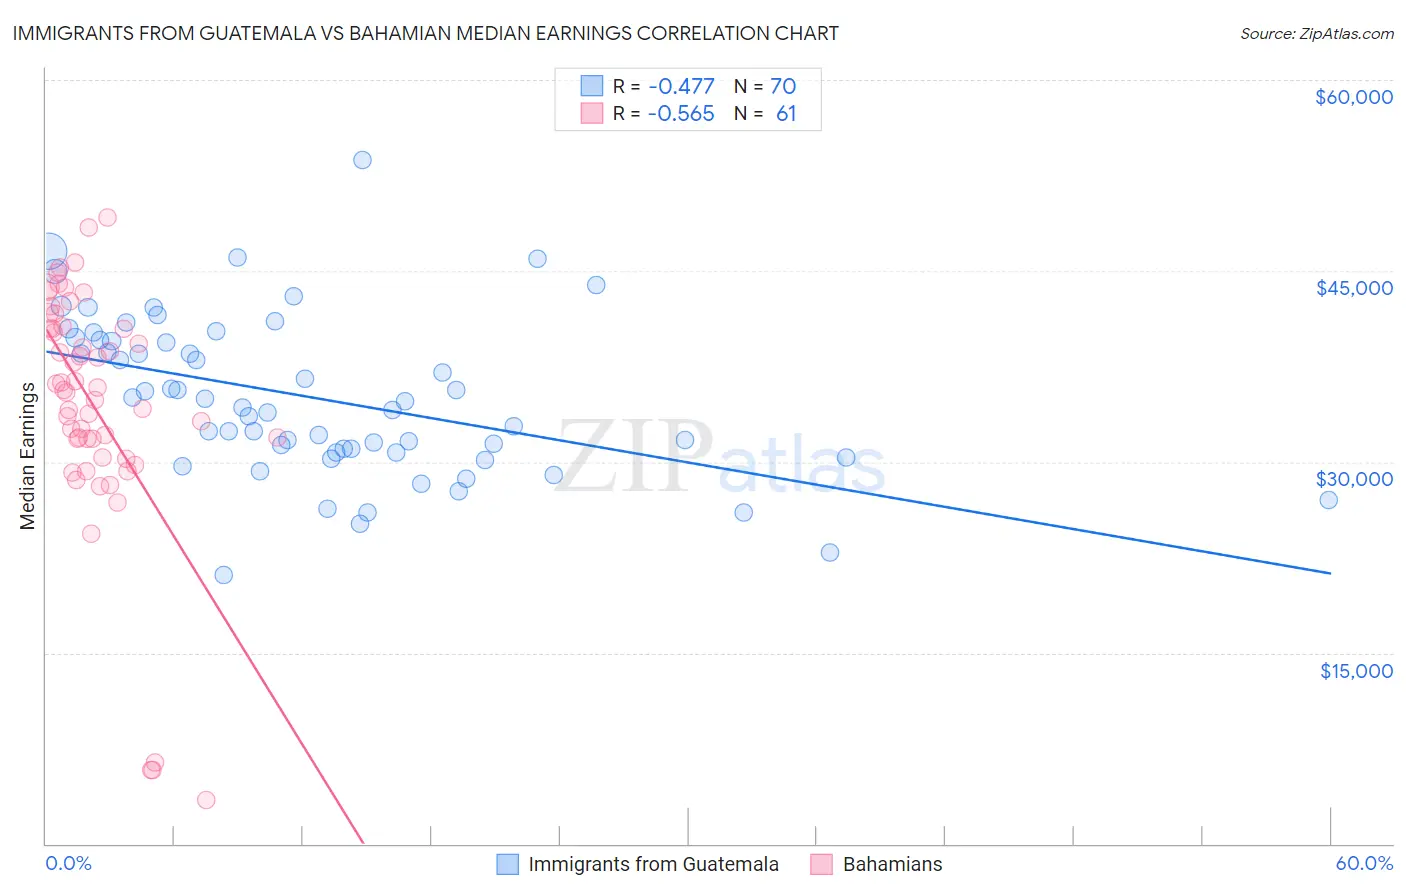
Immigrants from Guatemala vs Bahamian Median Earnings Correlation Chart
The statistical analysis conducted on geographies consisting of 377,268,152 people shows a moderate negative correlation between the proportion of Immigrants from Guatemala and median earnings in the United States with a correlation coefficient (R) of -0.477 and weighted average of $40,851. Similarly, the statistical analysis conducted on geographies consisting of 112,703,764 people shows a substantial negative correlation between the proportion of Bahamians and median earnings in the United States with a correlation coefficient (R) of -0.565 and weighted average of $39,735, a difference of 2.8%.
Median Earnings Correlation Summary
| Measurement | Immigrants from Guatemala | Bahamian |
| Minimum | $21,140 | $3,467 |
| Maximum | $53,713 | $49,150 |
| Range | $32,573 | $45,683 |
| Mean | $35,043 | $34,478 |
| Median | $34,514 | $35,694 |
| Interquartile 25% (IQ1) | $30,761 | $31,085 |
| Interquartile 75% (IQ3) | $39,604 | $40,552 |
| Interquartile Range (IQR) | $8,843 | $9,467 |
| Standard Deviation (Sample) | $6,256 | $9,647 |
| Standard Deviation (Population) | $6,211 | $9,567 |
Demographics Similar to Immigrants from Guatemala and Bahamians by Median Earnings
In terms of median earnings, the demographic groups most similar to Immigrants from Guatemala are Haitian ($40,918, a difference of 0.16%), Chickasaw ($40,672, a difference of 0.44%), Yaqui ($40,647, a difference of 0.50%), Honduran ($40,638, a difference of 0.52%), and Cuban ($40,619, a difference of 0.57%). Similarly, the demographic groups most similar to Bahamians are Immigrants from Central America ($39,762, a difference of 0.070%), Mexican ($39,834, a difference of 0.25%), Immigrants from Bahamas ($39,861, a difference of 0.32%), Black/African American ($40,085, a difference of 0.88%), and Dutch West Indian ($40,107, a difference of 0.94%).
| Demographics | Rating | Rank | Median Earnings |
| Haitians | 0.0 /100 | #303 | Tragic $40,918 |
| Immigrants | Guatemala | 0.0 /100 | #304 | Tragic $40,851 |
| Chickasaw | 0.0 /100 | #305 | Tragic $40,672 |
| Yaqui | 0.0 /100 | #306 | Tragic $40,647 |
| Hondurans | 0.0 /100 | #307 | Tragic $40,638 |
| Cubans | 0.0 /100 | #308 | Tragic $40,619 |
| Immigrants | Haiti | 0.0 /100 | #309 | Tragic $40,550 |
| Apache | 0.0 /100 | #310 | Tragic $40,388 |
| Hispanics or Latinos | 0.0 /100 | #311 | Tragic $40,288 |
| Chippewa | 0.0 /100 | #312 | Tragic $40,287 |
| Choctaw | 0.0 /100 | #313 | Tragic $40,270 |
| Cheyenne | 0.0 /100 | #314 | Tragic $40,233 |
| Seminole | 0.0 /100 | #315 | Tragic $40,233 |
| Immigrants | Honduras | 0.0 /100 | #316 | Tragic $40,195 |
| Fijians | 0.0 /100 | #317 | Tragic $40,193 |
| Dutch West Indians | 0.0 /100 | #318 | Tragic $40,107 |
| Blacks/African Americans | 0.0 /100 | #319 | Tragic $40,085 |
| Immigrants | Bahamas | 0.0 /100 | #320 | Tragic $39,861 |
| Mexicans | 0.0 /100 | #321 | Tragic $39,834 |
| Immigrants | Central America | 0.0 /100 | #322 | Tragic $39,762 |
| Bahamians | 0.0 /100 | #323 | Tragic $39,735 |