Immigrants from Portugal vs Subsaharan African Householder Income Ages 45 - 64 years
COMPARE
Immigrants from Portugal
Subsaharan African
Householder Income Ages 45 - 64 years
Householder Income Ages 45 - 64 years Comparison
Immigrants from Portugal
Sub-Saharan Africans
$99,203
HOUSEHOLDER INCOME AGES 45 - 64 YEARS
36.3/ 100
METRIC RATING
188th/ 347
METRIC RANK
$90,691
HOUSEHOLDER INCOME AGES 45 - 64 YEARS
0.8/ 100
METRIC RATING
250th/ 347
METRIC RANK
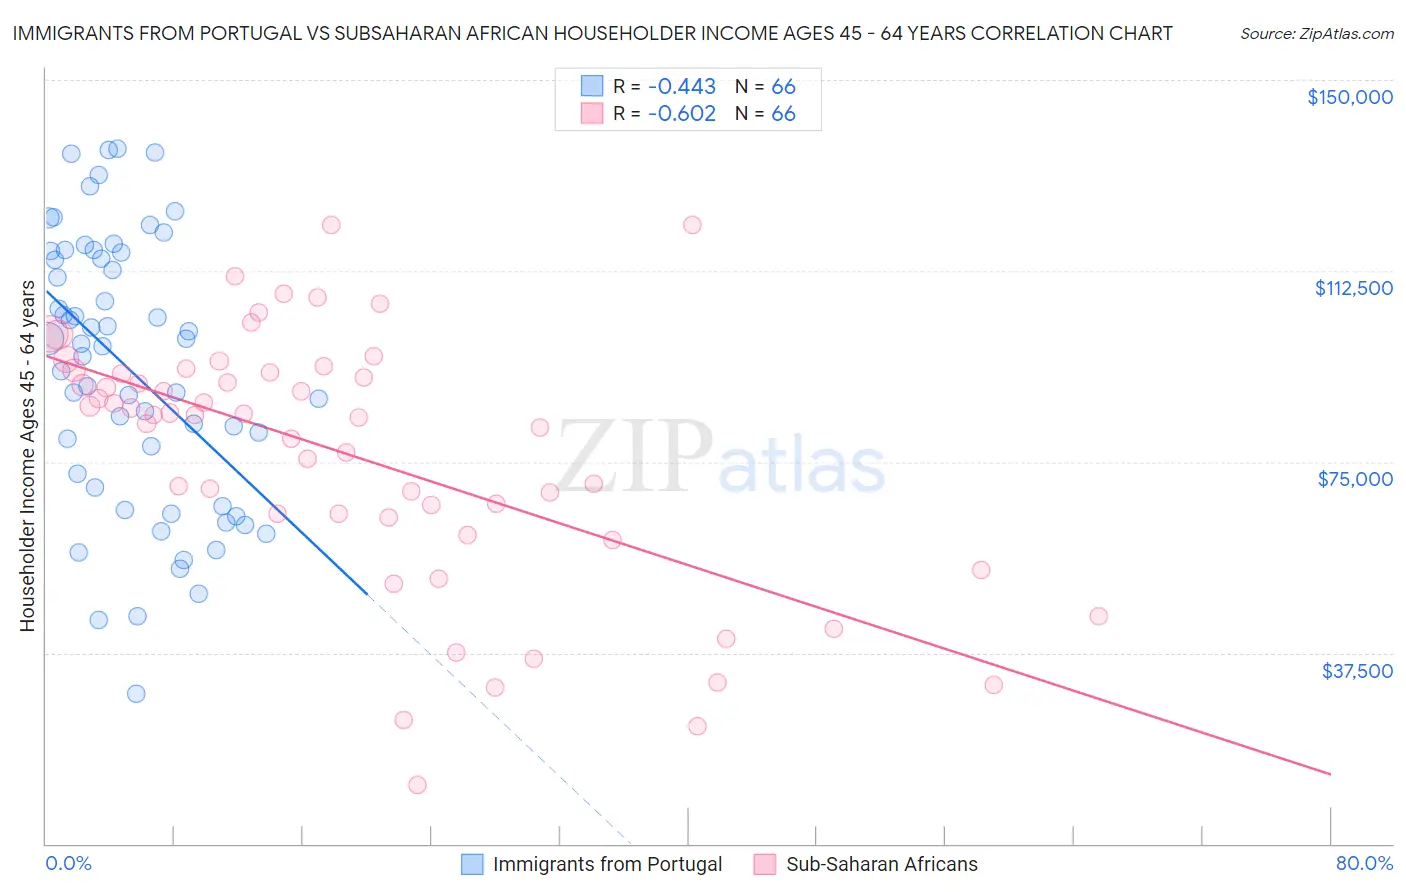
Immigrants from Portugal vs Subsaharan African Householder Income Ages 45 - 64 years Correlation Chart
The statistical analysis conducted on geographies consisting of 174,709,169 people shows a moderate negative correlation between the proportion of Immigrants from Portugal and household income with householder between the ages 45 and 64 in the United States with a correlation coefficient (R) of -0.443 and weighted average of $99,203. Similarly, the statistical analysis conducted on geographies consisting of 506,198,662 people shows a significant negative correlation between the proportion of Sub-Saharan Africans and household income with householder between the ages 45 and 64 in the United States with a correlation coefficient (R) of -0.602 and weighted average of $90,691, a difference of 9.4%.
Householder Income Ages 45 - 64 years Correlation Summary
| Measurement | Immigrants from Portugal | Subsaharan African |
| Minimum | $29,554 | $11,458 |
| Maximum | $136,394 | $121,610 |
| Range | $106,840 | $110,152 |
| Mean | $93,039 | $76,045 |
| Median | $97,899 | $84,198 |
| Interquartile 25% (IQ1) | $70,027 | $64,056 |
| Interquartile 75% (IQ3) | $116,103 | $92,645 |
| Interquartile Range (IQR) | $46,076 | $28,589 |
| Standard Deviation (Sample) | $26,518 | $25,098 |
| Standard Deviation (Population) | $26,316 | $24,907 |
Similar Demographics by Householder Income Ages 45 - 64 years
Demographics Similar to Immigrants from Portugal by Householder Income Ages 45 - 64 years
In terms of householder income ages 45 - 64 years, the demographic groups most similar to Immigrants from Portugal are Immigrants from South America ($99,126, a difference of 0.080%), French Canadian ($99,093, a difference of 0.11%), Iraqi ($99,387, a difference of 0.19%), Kenyan ($98,970, a difference of 0.24%), and Celtic ($98,896, a difference of 0.31%).
| Demographics | Rating | Rank | Householder Income Ages 45 - 64 years |
| Immigrants | Immigrants | 45.3 /100 | #181 | Average $99,943 |
| Finns | 44.8 /100 | #182 | Average $99,904 |
| Spaniards | 44.6 /100 | #183 | Average $99,889 |
| French | 43.8 /100 | #184 | Average $99,824 |
| Colombians | 43.2 /100 | #185 | Average $99,772 |
| Dutch | 41.7 /100 | #186 | Average $99,650 |
| Iraqis | 38.5 /100 | #187 | Fair $99,387 |
| Immigrants | Portugal | 36.3 /100 | #188 | Fair $99,203 |
| Immigrants | South America | 35.4 /100 | #189 | Fair $99,126 |
| French Canadians | 35.1 /100 | #190 | Fair $99,093 |
| Kenyans | 33.7 /100 | #191 | Fair $98,970 |
| Celtics | 32.9 /100 | #192 | Fair $98,896 |
| Hawaiians | 31.6 /100 | #193 | Fair $98,778 |
| Uruguayans | 30.3 /100 | #194 | Fair $98,660 |
| Spanish | 29.2 /100 | #195 | Fair $98,554 |
Demographics Similar to Sub-Saharan Africans by Householder Income Ages 45 - 64 years
In terms of householder income ages 45 - 64 years, the demographic groups most similar to Sub-Saharan Africans are Mexican American Indian ($90,811, a difference of 0.13%), American ($90,536, a difference of 0.17%), Immigrants from Laos ($90,909, a difference of 0.24%), Marshallese ($90,455, a difference of 0.26%), and Central American ($90,951, a difference of 0.29%).
| Demographics | Rating | Rank | Householder Income Ages 45 - 64 years |
| Immigrants | Trinidad and Tobago | 1.1 /100 | #243 | Tragic $91,347 |
| Immigrants | Middle Africa | 1.1 /100 | #244 | Tragic $91,293 |
| Guyanese | 0.9 /100 | #245 | Tragic $90,966 |
| Central Americans | 0.9 /100 | #246 | Tragic $90,951 |
| Alaskan Athabascans | 0.9 /100 | #247 | Tragic $90,951 |
| Immigrants | Laos | 0.9 /100 | #248 | Tragic $90,909 |
| Mexican American Indians | 0.8 /100 | #249 | Tragic $90,811 |
| Sub-Saharan Africans | 0.8 /100 | #250 | Tragic $90,691 |
| Americans | 0.7 /100 | #251 | Tragic $90,536 |
| Marshallese | 0.7 /100 | #252 | Tragic $90,455 |
| Barbadians | 0.6 /100 | #253 | Tragic $90,266 |
| Immigrants | Guyana | 0.6 /100 | #254 | Tragic $90,186 |
| West Indians | 0.5 /100 | #255 | Tragic $89,906 |
| French American Indians | 0.5 /100 | #256 | Tragic $89,811 |
| German Russians | 0.4 /100 | #257 | Tragic $89,398 |