Yuman vs Malaysian Median Household Income
COMPARE
Yuman
Malaysian
Median Household Income
Median Household Income Comparison
Yuman
Malaysians
$68,743
MEDIAN HOUSEHOLD INCOME
0.0/ 100
METRIC RATING
326th/ 347
METRIC RANK
$81,064
MEDIAN HOUSEHOLD INCOME
7.0/ 100
METRIC RATING
224th/ 347
METRIC RANK
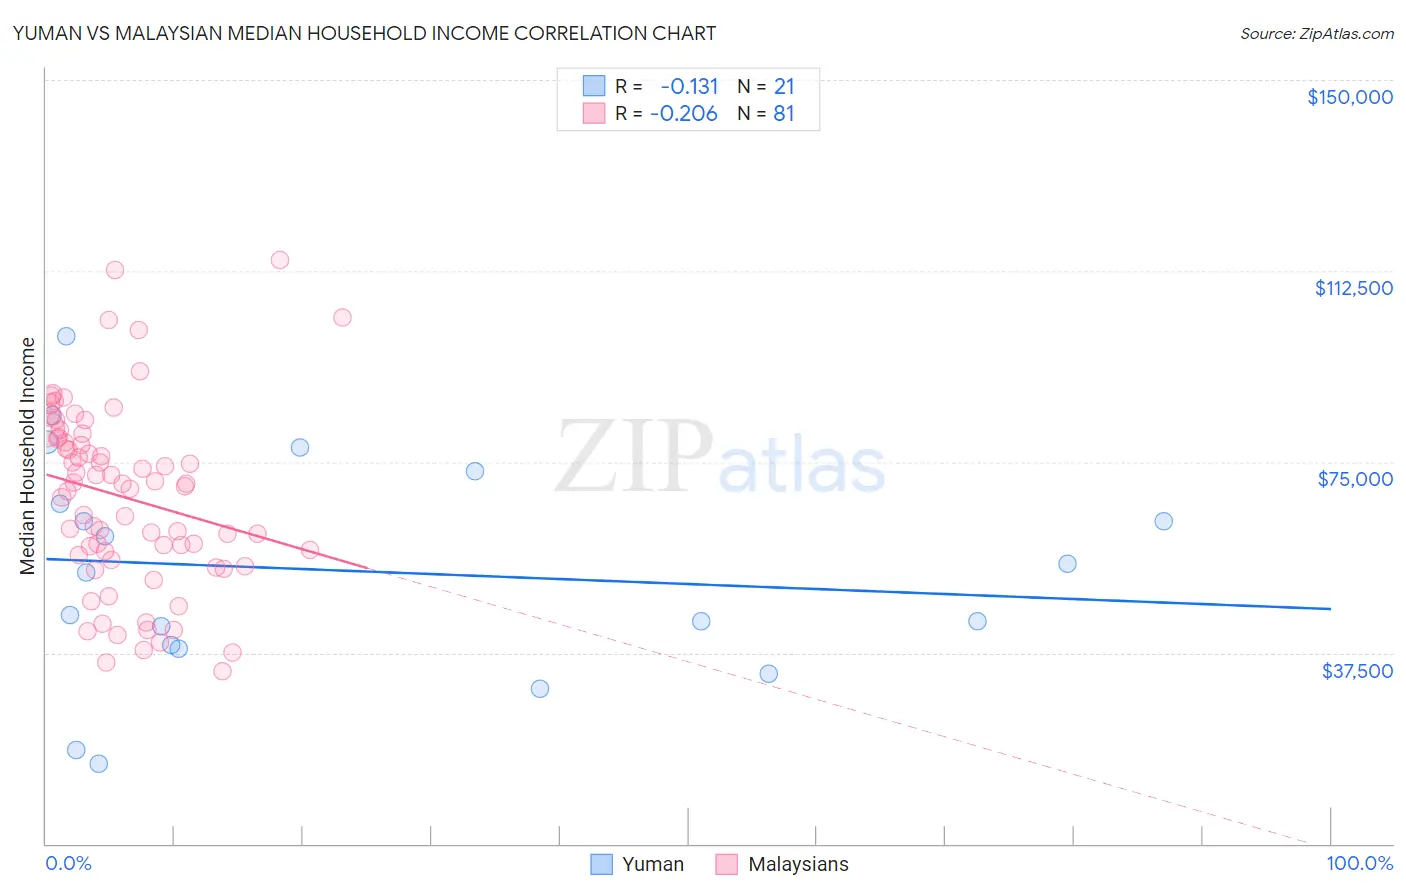
Yuman vs Malaysian Median Household Income Correlation Chart
The statistical analysis conducted on geographies consisting of 40,662,869 people shows a poor negative correlation between the proportion of Yuman and median household income in the United States with a correlation coefficient (R) of -0.131 and weighted average of $68,743. Similarly, the statistical analysis conducted on geographies consisting of 225,962,750 people shows a weak negative correlation between the proportion of Malaysians and median household income in the United States with a correlation coefficient (R) of -0.206 and weighted average of $81,064, a difference of 17.9%.
Median Household Income Correlation Summary
| Measurement | Yuman | Malaysian |
| Minimum | $15,625 | $33,804 |
| Maximum | $99,695 | $114,680 |
| Range | $84,070 | $80,876 |
| Mean | $53,635 | $68,008 |
| Median | $53,295 | $70,094 |
| Interquartile 25% (IQ1) | $38,762 | $56,150 |
| Interquartile 75% (IQ3) | $69,936 | $79,730 |
| Interquartile Range (IQR) | $31,174 | $23,581 |
| Standard Deviation (Sample) | $21,822 | $17,902 |
| Standard Deviation (Population) | $21,296 | $17,791 |
Similar Demographics by Median Household Income
Demographics Similar to Yuman by Median Household Income
In terms of median household income, the demographic groups most similar to Yuman are Immigrants from Cuba ($68,461, a difference of 0.41%), Menominee ($68,423, a difference of 0.47%), Dutch West Indian ($68,412, a difference of 0.48%), Seminole ($69,420, a difference of 0.98%), and Arapaho ($67,965, a difference of 1.1%).
| Demographics | Rating | Rank | Median Household Income |
| Immigrants | Dominican Republic | 0.0 /100 | #319 | Tragic $70,208 |
| Colville | 0.0 /100 | #320 | Tragic $70,094 |
| Chickasaw | 0.0 /100 | #321 | Tragic $70,005 |
| Choctaw | 0.0 /100 | #322 | Tragic $69,947 |
| Bahamians | 0.0 /100 | #323 | Tragic $69,726 |
| Yup'ik | 0.0 /100 | #324 | Tragic $69,695 |
| Seminole | 0.0 /100 | #325 | Tragic $69,420 |
| Yuman | 0.0 /100 | #326 | Tragic $68,743 |
| Immigrants | Cuba | 0.0 /100 | #327 | Tragic $68,461 |
| Menominee | 0.0 /100 | #328 | Tragic $68,423 |
| Dutch West Indians | 0.0 /100 | #329 | Tragic $68,412 |
| Arapaho | 0.0 /100 | #330 | Tragic $67,965 |
| Natives/Alaskans | 0.0 /100 | #331 | Tragic $67,879 |
| Sioux | 0.0 /100 | #332 | Tragic $67,792 |
| Creek | 0.0 /100 | #333 | Tragic $67,715 |
Demographics Similar to Malaysians by Median Household Income
In terms of median household income, the demographic groups most similar to Malaysians are Scotch-Irish ($80,972, a difference of 0.11%), Immigrants from El Salvador ($81,213, a difference of 0.18%), Immigrants from Nigeria ($81,236, a difference of 0.21%), Immigrants from Panama ($80,873, a difference of 0.24%), and Guyanese ($80,734, a difference of 0.41%).
| Demographics | Rating | Rank | Median Household Income |
| Ecuadorians | 12.5 /100 | #217 | Poor $82,070 |
| Whites/Caucasians | 12.2 /100 | #218 | Poor $82,029 |
| Nigerians | 10.3 /100 | #219 | Poor $81,725 |
| Immigrants | Venezuela | 9.0 /100 | #220 | Tragic $81,506 |
| Immigrants | Ghana | 9.0 /100 | #221 | Tragic $81,489 |
| Immigrants | Nigeria | 7.7 /100 | #222 | Tragic $81,236 |
| Immigrants | El Salvador | 7.6 /100 | #223 | Tragic $81,213 |
| Malaysians | 7.0 /100 | #224 | Tragic $81,064 |
| Scotch-Irish | 6.6 /100 | #225 | Tragic $80,972 |
| Immigrants | Panama | 6.2 /100 | #226 | Tragic $80,873 |
| Guyanese | 5.7 /100 | #227 | Tragic $80,734 |
| Immigrants | Bangladesh | 5.7 /100 | #228 | Tragic $80,722 |
| Delaware | 5.0 /100 | #229 | Tragic $80,527 |
| Bermudans | 4.7 /100 | #230 | Tragic $80,406 |
| Trinidadians and Tobagonians | 4.7 /100 | #231 | Tragic $80,402 |