Yuman vs Immigrants from Western Europe Median Household Income
COMPARE
Yuman
Immigrants from Western Europe
Median Household Income
Median Household Income Comparison
Yuman
Immigrants from Western Europe
$68,743
MEDIAN HOUSEHOLD INCOME
0.0/ 100
METRIC RATING
326th/ 347
METRIC RANK
$91,936
MEDIAN HOUSEHOLD INCOME
98.8/ 100
METRIC RATING
92nd/ 347
METRIC RANK
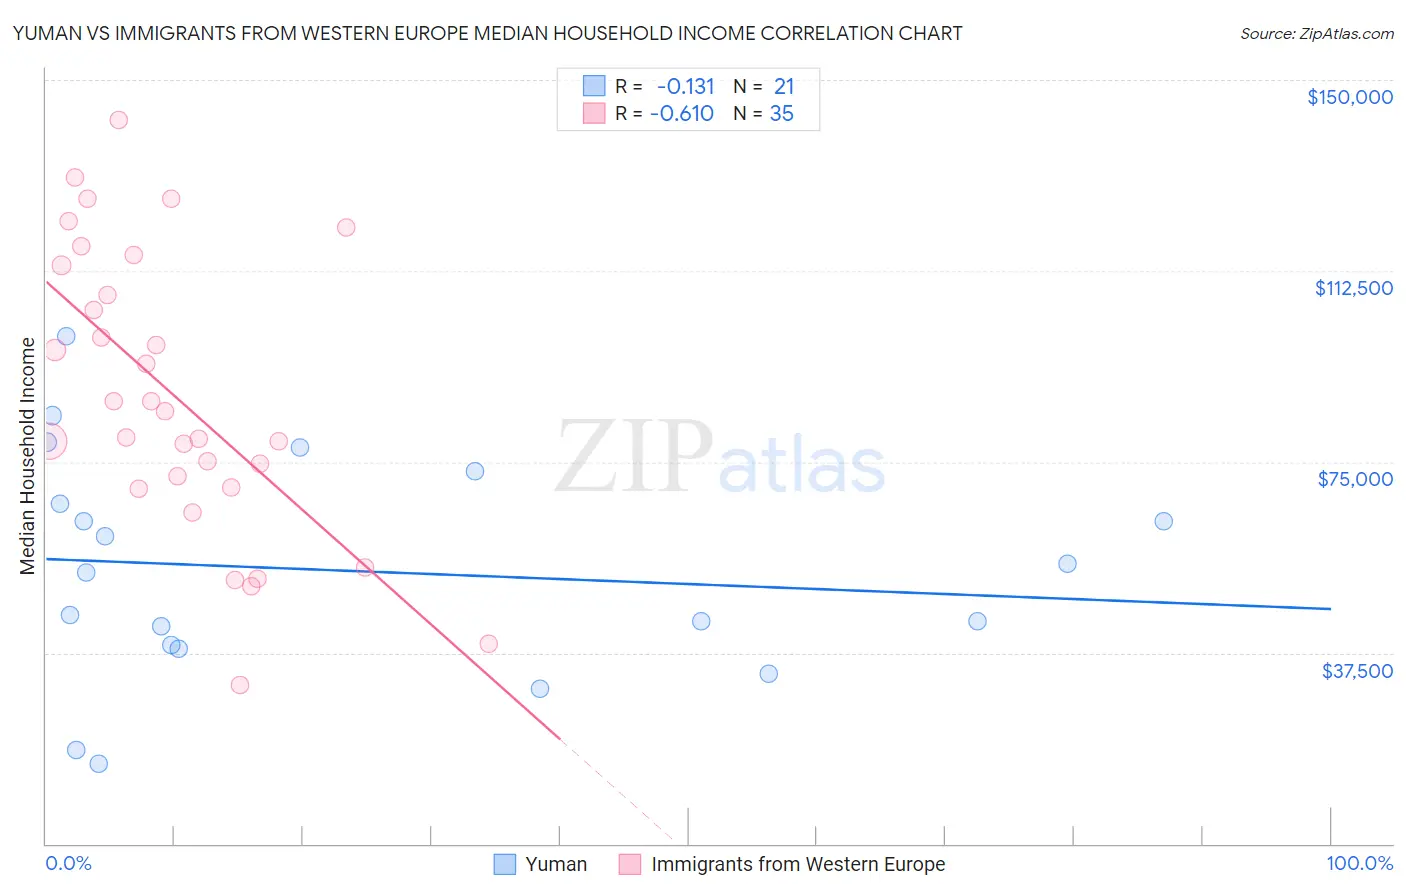
Yuman vs Immigrants from Western Europe Median Household Income Correlation Chart
The statistical analysis conducted on geographies consisting of 40,662,869 people shows a poor negative correlation between the proportion of Yuman and median household income in the United States with a correlation coefficient (R) of -0.131 and weighted average of $68,743. Similarly, the statistical analysis conducted on geographies consisting of 493,674,241 people shows a significant negative correlation between the proportion of Immigrants from Western Europe and median household income in the United States with a correlation coefficient (R) of -0.610 and weighted average of $91,936, a difference of 33.7%.
Median Household Income Correlation Summary
| Measurement | Yuman | Immigrants from Western Europe |
| Minimum | $15,625 | $31,182 |
| Maximum | $99,695 | $142,061 |
| Range | $84,070 | $110,879 |
| Mean | $53,635 | $87,927 |
| Median | $53,295 | $84,863 |
| Interquartile 25% (IQ1) | $38,762 | $69,977 |
| Interquartile 75% (IQ3) | $69,936 | $113,640 |
| Interquartile Range (IQR) | $31,174 | $43,663 |
| Standard Deviation (Sample) | $21,822 | $27,795 |
| Standard Deviation (Population) | $21,296 | $27,395 |
Similar Demographics by Median Household Income
Demographics Similar to Yuman by Median Household Income
In terms of median household income, the demographic groups most similar to Yuman are Immigrants from Cuba ($68,461, a difference of 0.41%), Menominee ($68,423, a difference of 0.47%), Dutch West Indian ($68,412, a difference of 0.48%), Seminole ($69,420, a difference of 0.98%), and Arapaho ($67,965, a difference of 1.1%).
| Demographics | Rating | Rank | Median Household Income |
| Immigrants | Dominican Republic | 0.0 /100 | #319 | Tragic $70,208 |
| Colville | 0.0 /100 | #320 | Tragic $70,094 |
| Chickasaw | 0.0 /100 | #321 | Tragic $70,005 |
| Choctaw | 0.0 /100 | #322 | Tragic $69,947 |
| Bahamians | 0.0 /100 | #323 | Tragic $69,726 |
| Yup'ik | 0.0 /100 | #324 | Tragic $69,695 |
| Seminole | 0.0 /100 | #325 | Tragic $69,420 |
| Yuman | 0.0 /100 | #326 | Tragic $68,743 |
| Immigrants | Cuba | 0.0 /100 | #327 | Tragic $68,461 |
| Menominee | 0.0 /100 | #328 | Tragic $68,423 |
| Dutch West Indians | 0.0 /100 | #329 | Tragic $68,412 |
| Arapaho | 0.0 /100 | #330 | Tragic $67,965 |
| Natives/Alaskans | 0.0 /100 | #331 | Tragic $67,879 |
| Sioux | 0.0 /100 | #332 | Tragic $67,792 |
| Creek | 0.0 /100 | #333 | Tragic $67,715 |
Demographics Similar to Immigrants from Western Europe by Median Household Income
In terms of median household income, the demographic groups most similar to Immigrants from Western Europe are Immigrants from Lebanon ($91,887, a difference of 0.050%), Romanian ($91,994, a difference of 0.060%), Assyrian/Chaldean/Syriac ($91,991, a difference of 0.060%), Immigrants from Vietnam ($91,987, a difference of 0.060%), and Immigrants from North America ($91,860, a difference of 0.080%).
| Demographics | Rating | Rank | Median Household Income |
| Immigrants | Croatia | 99.0 /100 | #85 | Exceptional $92,225 |
| Immigrants | England | 98.9 /100 | #86 | Exceptional $92,098 |
| Immigrants | Hungary | 98.9 /100 | #87 | Exceptional $92,094 |
| Immigrants | Canada | 98.8 /100 | #88 | Exceptional $92,029 |
| Romanians | 98.8 /100 | #89 | Exceptional $91,994 |
| Assyrians/Chaldeans/Syriacs | 98.8 /100 | #90 | Exceptional $91,991 |
| Immigrants | Vietnam | 98.8 /100 | #91 | Exceptional $91,987 |
| Immigrants | Western Europe | 98.8 /100 | #92 | Exceptional $91,936 |
| Immigrants | Lebanon | 98.7 /100 | #93 | Exceptional $91,887 |
| Immigrants | North America | 98.7 /100 | #94 | Exceptional $91,860 |
| Armenians | 98.7 /100 | #95 | Exceptional $91,807 |
| Jordanians | 98.7 /100 | #96 | Exceptional $91,794 |
| Immigrants | Serbia | 98.6 /100 | #97 | Exceptional $91,730 |
| Immigrants | Southern Europe | 98.5 /100 | #98 | Exceptional $91,605 |
| Immigrants | South Eastern Asia | 98.4 /100 | #99 | Exceptional $91,541 |