Yuman vs Malaysian Householder Income Ages 45 - 64 years
COMPARE
Yuman
Malaysian
Householder Income Ages 45 - 64 years
Householder Income Ages 45 - 64 years Comparison
Yuman
Malaysians
$82,139
HOUSEHOLDER INCOME AGES 45 - 64 YEARS
0.0/ 100
METRIC RATING
321st/ 347
METRIC RANK
$94,517
HOUSEHOLDER INCOME AGES 45 - 64 YEARS
5.2/ 100
METRIC RATING
222nd/ 347
METRIC RANK
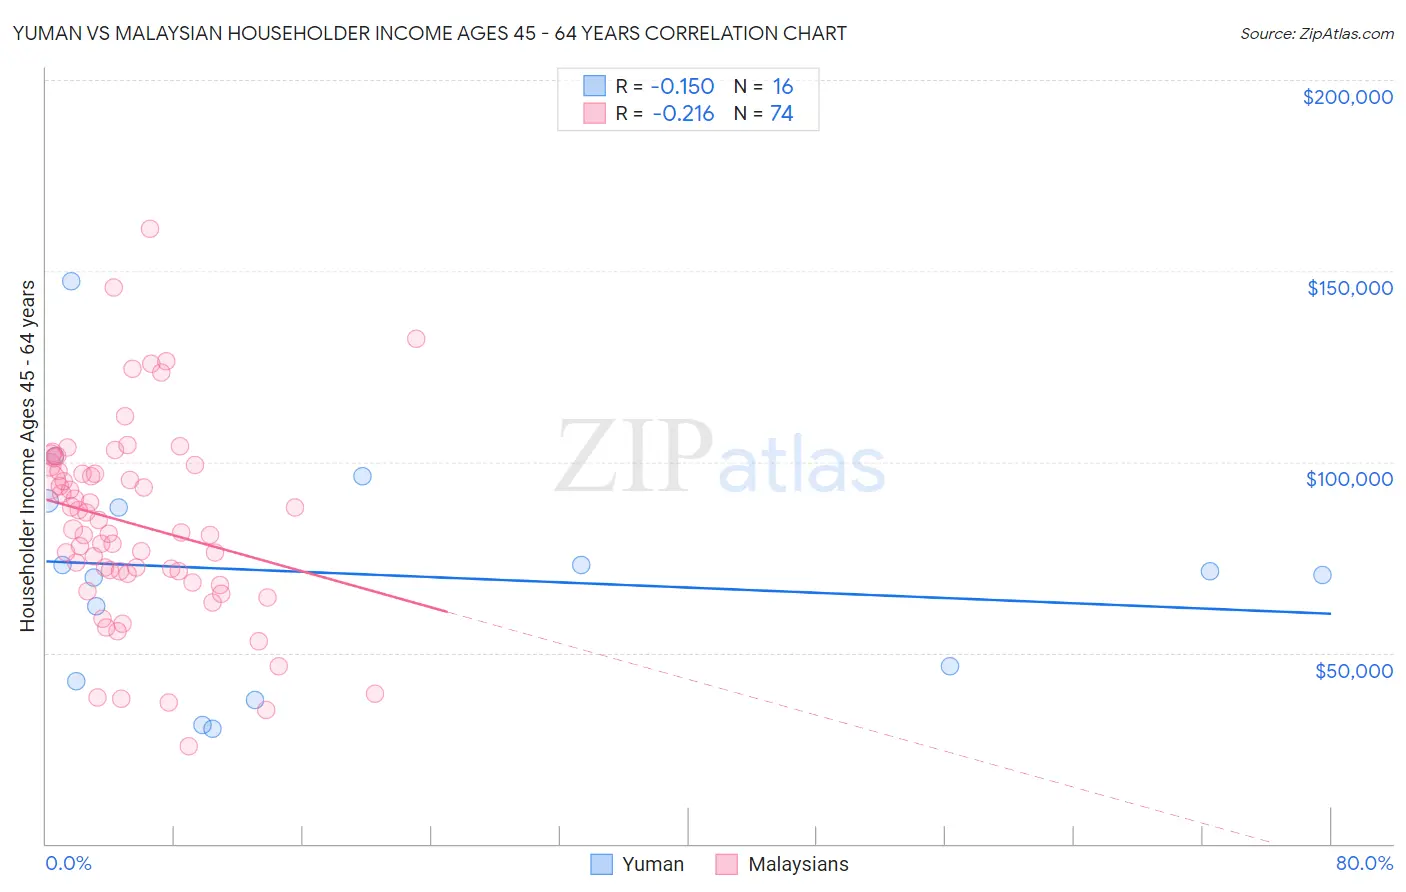
Yuman vs Malaysian Householder Income Ages 45 - 64 years Correlation Chart
The statistical analysis conducted on geographies consisting of 40,638,161 people shows a poor negative correlation between the proportion of Yuman and household income with householder between the ages 45 and 64 in the United States with a correlation coefficient (R) of -0.150 and weighted average of $82,139. Similarly, the statistical analysis conducted on geographies consisting of 225,853,925 people shows a weak negative correlation between the proportion of Malaysians and household income with householder between the ages 45 and 64 in the United States with a correlation coefficient (R) of -0.216 and weighted average of $94,517, a difference of 15.1%.
Householder Income Ages 45 - 64 years Correlation Summary
| Measurement | Yuman | Malaysian |
| Minimum | $30,086 | $25,536 |
| Maximum | $147,152 | $161,017 |
| Range | $117,066 | $135,481 |
| Mean | $70,628 | $83,626 |
| Median | $70,888 | $81,950 |
| Interquartile 25% (IQ1) | $44,573 | $70,625 |
| Interquartile 75% (IQ3) | $88,954 | $97,581 |
| Interquartile Range (IQR) | $44,381 | $26,956 |
| Standard Deviation (Sample) | $30,431 | $25,472 |
| Standard Deviation (Population) | $29,465 | $25,299 |
Similar Demographics by Householder Income Ages 45 - 64 years
Demographics Similar to Yuman by Householder Income Ages 45 - 64 years
In terms of householder income ages 45 - 64 years, the demographic groups most similar to Yuman are Apache ($82,184, a difference of 0.050%), Chickasaw ($82,193, a difference of 0.070%), Choctaw ($82,287, a difference of 0.18%), Colville ($82,474, a difference of 0.41%), and Immigrants from Caribbean ($82,513, a difference of 0.46%).
| Demographics | Rating | Rank | Householder Income Ages 45 - 64 years |
| Immigrants | Honduras | 0.0 /100 | #314 | Tragic $82,697 |
| Paiute | 0.0 /100 | #315 | Tragic $82,629 |
| Immigrants | Caribbean | 0.0 /100 | #316 | Tragic $82,513 |
| Colville | 0.0 /100 | #317 | Tragic $82,474 |
| Choctaw | 0.0 /100 | #318 | Tragic $82,287 |
| Chickasaw | 0.0 /100 | #319 | Tragic $82,193 |
| Apache | 0.0 /100 | #320 | Tragic $82,184 |
| Yuman | 0.0 /100 | #321 | Tragic $82,139 |
| Sioux | 0.0 /100 | #322 | Tragic $81,750 |
| Bahamians | 0.0 /100 | #323 | Tragic $81,369 |
| Yup'ik | 0.0 /100 | #324 | Tragic $81,000 |
| Immigrants | Cuba | 0.0 /100 | #325 | Tragic $80,662 |
| Dominicans | 0.0 /100 | #326 | Tragic $80,623 |
| Seminole | 0.0 /100 | #327 | Tragic $80,077 |
| Natives/Alaskans | 0.0 /100 | #328 | Tragic $79,816 |
Demographics Similar to Malaysians by Householder Income Ages 45 - 64 years
In terms of householder income ages 45 - 64 years, the demographic groups most similar to Malaysians are Nonimmigrants ($94,448, a difference of 0.070%), Immigrants from Bosnia and Herzegovina ($94,288, a difference of 0.24%), Immigrants from Nigeria ($94,804, a difference of 0.30%), Salvadoran ($94,842, a difference of 0.34%), and Bermudan ($94,197, a difference of 0.34%).
| Demographics | Rating | Rank | Householder Income Ages 45 - 64 years |
| Nigerians | 8.2 /100 | #215 | Tragic $95,492 |
| Immigrants | Venezuela | 7.6 /100 | #216 | Tragic $95,342 |
| Immigrants | Ghana | 6.4 /100 | #217 | Tragic $94,982 |
| Delaware | 6.2 /100 | #218 | Tragic $94,914 |
| Immigrants | Armenia | 6.1 /100 | #219 | Tragic $94,863 |
| Salvadorans | 6.0 /100 | #220 | Tragic $94,842 |
| Immigrants | Nigeria | 5.9 /100 | #221 | Tragic $94,804 |
| Malaysians | 5.2 /100 | #222 | Tragic $94,517 |
| Immigrants | Nonimmigrants | 5.0 /100 | #223 | Tragic $94,448 |
| Immigrants | Bosnia and Herzegovina | 4.6 /100 | #224 | Tragic $94,288 |
| Bermudans | 4.4 /100 | #225 | Tragic $94,197 |
| Immigrants | Azores | 4.3 /100 | #226 | Tragic $94,138 |
| Alaska Natives | 4.0 /100 | #227 | Tragic $93,991 |
| Immigrants | Panama | 3.7 /100 | #228 | Tragic $93,815 |
| Vietnamese | 3.6 /100 | #229 | Tragic $93,788 |