Yuman vs Malaysian 12th Grade, No Diploma
COMPARE
Yuman
Malaysian
12th Grade, No Diploma
12th Grade, No Diploma Comparison
Yuman
Malaysians
86.5%
12TH GRADE, NO DIPLOMA
0.0/ 100
METRIC RATING
323rd/ 347
METRIC RANK
89.2%
12TH GRADE, NO DIPLOMA
0.1/ 100
METRIC RATING
272nd/ 347
METRIC RANK
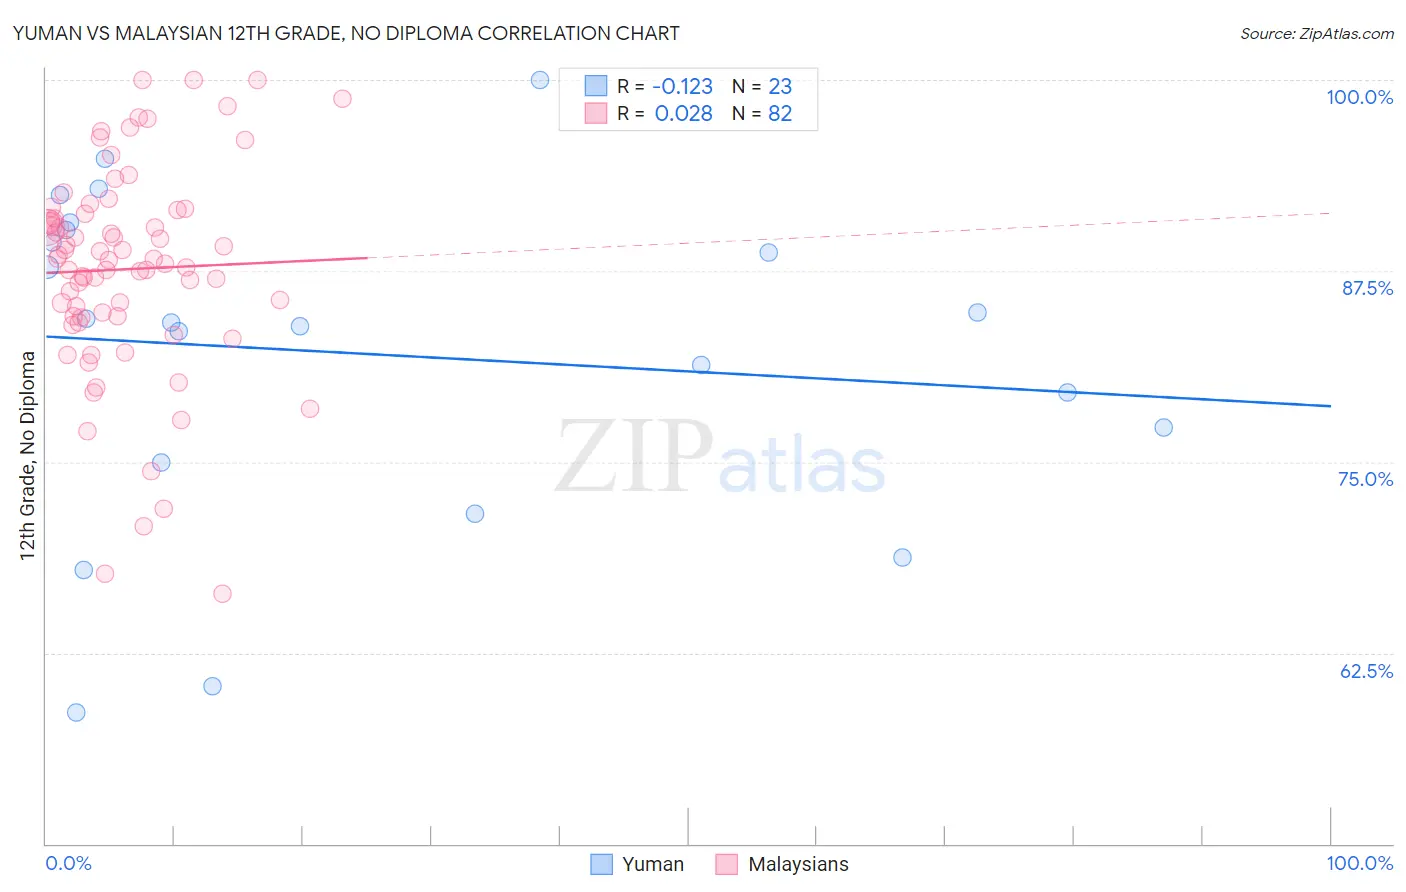
Yuman vs Malaysian 12th Grade, No Diploma Correlation Chart
The statistical analysis conducted on geographies consisting of 40,696,349 people shows a poor negative correlation between the proportion of Yuman and percentage of population with at least 12th grade (no diploma) education in the United States with a correlation coefficient (R) of -0.123 and weighted average of 86.5%. Similarly, the statistical analysis conducted on geographies consisting of 226,109,984 people shows no correlation between the proportion of Malaysians and percentage of population with at least 12th grade (no diploma) education in the United States with a correlation coefficient (R) of 0.028 and weighted average of 89.2%, a difference of 3.2%.
12th Grade, No Diploma Correlation Summary
| Measurement | Yuman | Malaysian |
| Minimum | 58.6% | 66.4% |
| Maximum | 100.0% | 100.0% |
| Range | 41.4% | 33.6% |
| Mean | 82.1% | 87.6% |
| Median | 84.1% | 88.2% |
| Interquartile 25% (IQ1) | 74.9% | 84.5% |
| Interquartile 75% (IQ3) | 90.2% | 91.2% |
| Interquartile Range (IQR) | 15.3% | 6.7% |
| Standard Deviation (Sample) | 10.9% | 6.9% |
| Standard Deviation (Population) | 10.6% | 6.8% |
Similar Demographics by 12th Grade, No Diploma
Demographics Similar to Yuman by 12th Grade, No Diploma
In terms of 12th grade, no diploma, the demographic groups most similar to Yuman are Central American Indian (86.5%, a difference of 0.0%), Puerto Rican (86.5%, a difference of 0.080%), Immigrants from Nicaragua (86.6%, a difference of 0.11%), Immigrants from Belize (87.0%, a difference of 0.57%), and Belizean (87.0%, a difference of 0.65%).
| Demographics | Rating | Rank | 12th Grade, No Diploma |
| Apache | 0.0 /100 | #316 | Tragic 87.3% |
| Navajo | 0.0 /100 | #317 | Tragic 87.1% |
| Belizeans | 0.0 /100 | #318 | Tragic 87.0% |
| Immigrants | Belize | 0.0 /100 | #319 | Tragic 87.0% |
| Immigrants | Nicaragua | 0.0 /100 | #320 | Tragic 86.6% |
| Puerto Ricans | 0.0 /100 | #321 | Tragic 86.5% |
| Central American Indians | 0.0 /100 | #322 | Tragic 86.5% |
| Yuman | 0.0 /100 | #323 | Tragic 86.5% |
| Immigrants | Cabo Verde | 0.0 /100 | #324 | Tragic 85.8% |
| Mexican American Indians | 0.0 /100 | #325 | Tragic 85.7% |
| Dominicans | 0.0 /100 | #326 | Tragic 85.7% |
| Lumbee | 0.0 /100 | #327 | Tragic 85.7% |
| Hondurans | 0.0 /100 | #328 | Tragic 85.5% |
| Hispanics or Latinos | 0.0 /100 | #329 | Tragic 85.4% |
| Immigrants | Azores | 0.0 /100 | #330 | Tragic 85.3% |
Demographics Similar to Malaysians by 12th Grade, No Diploma
In terms of 12th grade, no diploma, the demographic groups most similar to Malaysians are Black/African American (89.3%, a difference of 0.010%), Bangladeshi (89.3%, a difference of 0.020%), U.S. Virgin Islander (89.3%, a difference of 0.060%), Immigrants from Trinidad and Tobago (89.3%, a difference of 0.10%), and Seminole (89.4%, a difference of 0.12%).
| Demographics | Rating | Rank | 12th Grade, No Diploma |
| Trinidadians and Tobagonians | 0.2 /100 | #265 | Tragic 89.4% |
| Seminole | 0.2 /100 | #266 | Tragic 89.4% |
| West Indians | 0.2 /100 | #267 | Tragic 89.3% |
| Immigrants | Trinidad and Tobago | 0.1 /100 | #268 | Tragic 89.3% |
| U.S. Virgin Islanders | 0.1 /100 | #269 | Tragic 89.3% |
| Bangladeshis | 0.1 /100 | #270 | Tragic 89.3% |
| Blacks/African Americans | 0.1 /100 | #271 | Tragic 89.3% |
| Malaysians | 0.1 /100 | #272 | Tragic 89.2% |
| Barbadians | 0.1 /100 | #273 | Tragic 89.1% |
| Cajuns | 0.1 /100 | #274 | Tragic 89.1% |
| Immigrants | Congo | 0.1 /100 | #275 | Tragic 89.0% |
| Ute | 0.1 /100 | #276 | Tragic 89.0% |
| Immigrants | Barbados | 0.0 /100 | #277 | Tragic 89.0% |
| Immigrants | St. Vincent and the Grenadines | 0.0 /100 | #278 | Tragic 88.9% |
| Immigrants | Laos | 0.0 /100 | #279 | Tragic 88.9% |