Immigrants from Italy vs Malaysian Median Household Income
COMPARE
Immigrants from Italy
Malaysian
Median Household Income
Median Household Income Comparison
Immigrants from Italy
Malaysians
$93,465
MEDIAN HOUSEHOLD INCOME
99.5/ 100
METRIC RATING
75th/ 347
METRIC RANK
$81,064
MEDIAN HOUSEHOLD INCOME
7.0/ 100
METRIC RATING
224th/ 347
METRIC RANK
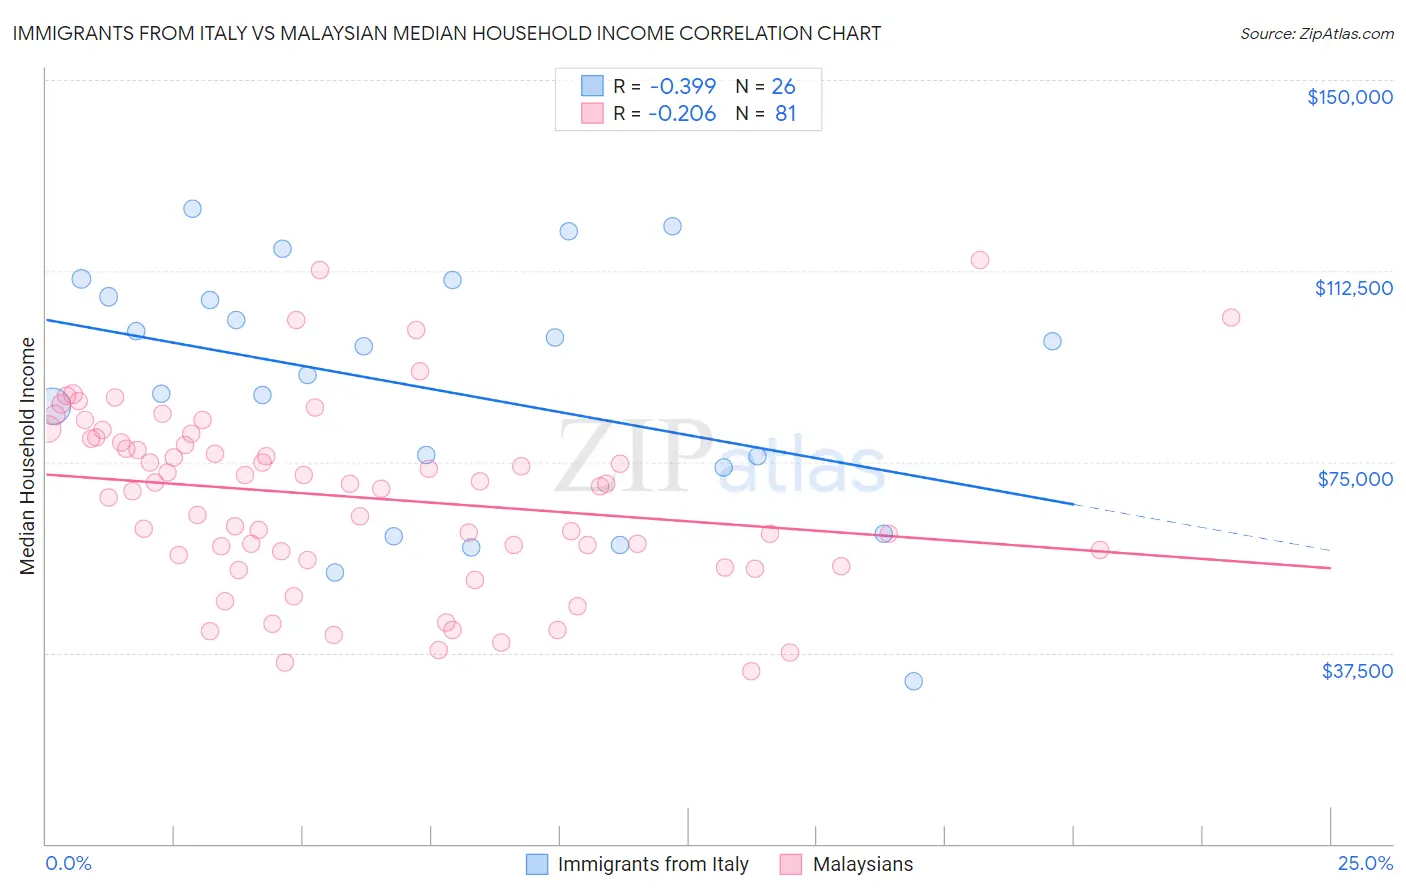
Immigrants from Italy vs Malaysian Median Household Income Correlation Chart
The statistical analysis conducted on geographies consisting of 324,128,900 people shows a mild negative correlation between the proportion of Immigrants from Italy and median household income in the United States with a correlation coefficient (R) of -0.399 and weighted average of $93,465. Similarly, the statistical analysis conducted on geographies consisting of 225,962,750 people shows a weak negative correlation between the proportion of Malaysians and median household income in the United States with a correlation coefficient (R) of -0.206 and weighted average of $81,064, a difference of 15.3%.
Median Household Income Correlation Summary
| Measurement | Immigrants from Italy | Malaysian |
| Minimum | $31,923 | $33,804 |
| Maximum | $124,607 | $114,680 |
| Range | $92,684 | $80,876 |
| Mean | $89,307 | $68,008 |
| Median | $94,900 | $70,094 |
| Interquartile 25% (IQ1) | $73,911 | $56,150 |
| Interquartile 75% (IQ3) | $107,408 | $79,730 |
| Interquartile Range (IQR) | $33,497 | $23,581 |
| Standard Deviation (Sample) | $24,372 | $17,902 |
| Standard Deviation (Population) | $23,899 | $17,791 |
Similar Demographics by Median Household Income
Demographics Similar to Immigrants from Italy by Median Household Income
In terms of median household income, the demographic groups most similar to Immigrants from Italy are South African ($93,379, a difference of 0.090%), Immigrants from Afghanistan ($93,375, a difference of 0.10%), Immigrants from Latvia ($93,602, a difference of 0.15%), Immigrants from Egypt ($93,700, a difference of 0.25%), and Immigrants from Bulgaria ($93,148, a difference of 0.34%).
| Demographics | Rating | Rank | Median Household Income |
| Mongolians | 99.7 /100 | #68 | Exceptional $93,971 |
| Argentineans | 99.7 /100 | #69 | Exceptional $93,960 |
| Immigrants | Fiji | 99.7 /100 | #70 | Exceptional $93,933 |
| Immigrants | Philippines | 99.6 /100 | #71 | Exceptional $93,899 |
| Lithuanians | 99.6 /100 | #72 | Exceptional $93,852 |
| Immigrants | Egypt | 99.6 /100 | #73 | Exceptional $93,700 |
| Immigrants | Latvia | 99.6 /100 | #74 | Exceptional $93,602 |
| Immigrants | Italy | 99.5 /100 | #75 | Exceptional $93,465 |
| South Africans | 99.5 /100 | #76 | Exceptional $93,379 |
| Immigrants | Afghanistan | 99.5 /100 | #77 | Exceptional $93,375 |
| Immigrants | Bulgaria | 99.4 /100 | #78 | Exceptional $93,148 |
| Sri Lankans | 99.4 /100 | #79 | Exceptional $93,093 |
| Tongans | 99.4 /100 | #80 | Exceptional $93,076 |
| Immigrants | Eastern Europe | 99.4 /100 | #81 | Exceptional $93,051 |
| Immigrants | Spain | 99.3 /100 | #82 | Exceptional $92,732 |
Demographics Similar to Malaysians by Median Household Income
In terms of median household income, the demographic groups most similar to Malaysians are Scotch-Irish ($80,972, a difference of 0.11%), Immigrants from El Salvador ($81,213, a difference of 0.18%), Immigrants from Nigeria ($81,236, a difference of 0.21%), Immigrants from Panama ($80,873, a difference of 0.24%), and Guyanese ($80,734, a difference of 0.41%).
| Demographics | Rating | Rank | Median Household Income |
| Ecuadorians | 12.5 /100 | #217 | Poor $82,070 |
| Whites/Caucasians | 12.2 /100 | #218 | Poor $82,029 |
| Nigerians | 10.3 /100 | #219 | Poor $81,725 |
| Immigrants | Venezuela | 9.0 /100 | #220 | Tragic $81,506 |
| Immigrants | Ghana | 9.0 /100 | #221 | Tragic $81,489 |
| Immigrants | Nigeria | 7.7 /100 | #222 | Tragic $81,236 |
| Immigrants | El Salvador | 7.6 /100 | #223 | Tragic $81,213 |
| Malaysians | 7.0 /100 | #224 | Tragic $81,064 |
| Scotch-Irish | 6.6 /100 | #225 | Tragic $80,972 |
| Immigrants | Panama | 6.2 /100 | #226 | Tragic $80,873 |
| Guyanese | 5.7 /100 | #227 | Tragic $80,734 |
| Immigrants | Bangladesh | 5.7 /100 | #228 | Tragic $80,722 |
| Delaware | 5.0 /100 | #229 | Tragic $80,527 |
| Bermudans | 4.7 /100 | #230 | Tragic $80,406 |
| Trinidadians and Tobagonians | 4.7 /100 | #231 | Tragic $80,402 |