Immigrants from Sweden vs Malaysian Median Household Income
COMPARE
Immigrants from Sweden
Malaysian
Median Household Income
Median Household Income Comparison
Immigrants from Sweden
Malaysians
$100,699
MEDIAN HOUSEHOLD INCOME
100.0/ 100
METRIC RATING
25th/ 347
METRIC RANK
$81,064
MEDIAN HOUSEHOLD INCOME
7.0/ 100
METRIC RATING
224th/ 347
METRIC RANK
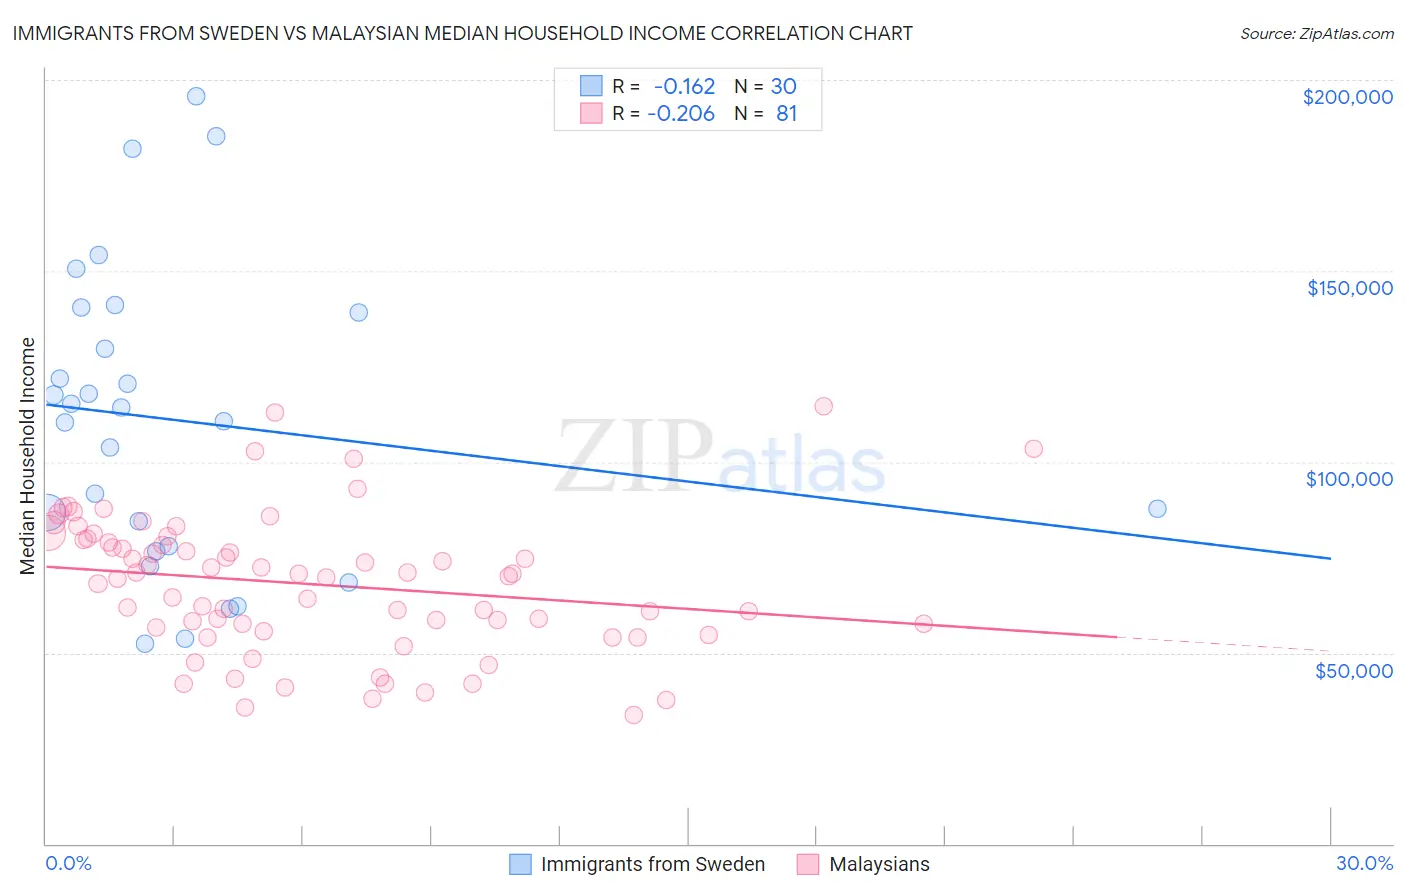
Immigrants from Sweden vs Malaysian Median Household Income Correlation Chart
The statistical analysis conducted on geographies consisting of 164,698,337 people shows a poor negative correlation between the proportion of Immigrants from Sweden and median household income in the United States with a correlation coefficient (R) of -0.162 and weighted average of $100,699. Similarly, the statistical analysis conducted on geographies consisting of 225,962,750 people shows a weak negative correlation between the proportion of Malaysians and median household income in the United States with a correlation coefficient (R) of -0.206 and weighted average of $81,064, a difference of 24.2%.
Median Household Income Correlation Summary
| Measurement | Immigrants from Sweden | Malaysian |
| Minimum | $52,323 | $33,804 |
| Maximum | $195,586 | $114,680 |
| Range | $143,263 | $80,876 |
| Mean | $110,867 | $68,008 |
| Median | $112,526 | $70,094 |
| Interquartile 25% (IQ1) | $78,036 | $56,150 |
| Interquartile 75% (IQ3) | $139,219 | $79,730 |
| Interquartile Range (IQR) | $61,183 | $23,581 |
| Standard Deviation (Sample) | $38,839 | $17,902 |
| Standard Deviation (Population) | $38,186 | $17,791 |
Similar Demographics by Median Household Income
Demographics Similar to Immigrants from Sweden by Median Household Income
In terms of median household income, the demographic groups most similar to Immigrants from Sweden are Immigrants from Japan ($100,711, a difference of 0.010%), Immigrants from Belgium ($100,306, a difference of 0.39%), Bhutanese ($100,151, a difference of 0.55%), Immigrants from Bolivia ($101,394, a difference of 0.69%), and Immigrants from Sri Lanka ($99,943, a difference of 0.76%).
| Demographics | Rating | Rank | Median Household Income |
| Cypriots | 100.0 /100 | #18 | Exceptional $102,843 |
| Immigrants | Australia | 100.0 /100 | #19 | Exceptional $102,562 |
| Bolivians | 100.0 /100 | #20 | Exceptional $102,195 |
| Eastern Europeans | 100.0 /100 | #21 | Exceptional $101,781 |
| Asians | 100.0 /100 | #22 | Exceptional $101,681 |
| Immigrants | Bolivia | 100.0 /100 | #23 | Exceptional $101,394 |
| Immigrants | Japan | 100.0 /100 | #24 | Exceptional $100,711 |
| Immigrants | Sweden | 100.0 /100 | #25 | Exceptional $100,699 |
| Immigrants | Belgium | 100.0 /100 | #26 | Exceptional $100,306 |
| Bhutanese | 100.0 /100 | #27 | Exceptional $100,151 |
| Immigrants | Sri Lanka | 100.0 /100 | #28 | Exceptional $99,943 |
| Immigrants | Asia | 100.0 /100 | #29 | Exceptional $99,933 |
| Immigrants | Northern Europe | 100.0 /100 | #30 | Exceptional $99,813 |
| Turks | 100.0 /100 | #31 | Exceptional $99,389 |
| Immigrants | Denmark | 100.0 /100 | #32 | Exceptional $98,510 |
Demographics Similar to Malaysians by Median Household Income
In terms of median household income, the demographic groups most similar to Malaysians are Scotch-Irish ($80,972, a difference of 0.11%), Immigrants from El Salvador ($81,213, a difference of 0.18%), Immigrants from Nigeria ($81,236, a difference of 0.21%), Immigrants from Panama ($80,873, a difference of 0.24%), and Guyanese ($80,734, a difference of 0.41%).
| Demographics | Rating | Rank | Median Household Income |
| Ecuadorians | 12.5 /100 | #217 | Poor $82,070 |
| Whites/Caucasians | 12.2 /100 | #218 | Poor $82,029 |
| Nigerians | 10.3 /100 | #219 | Poor $81,725 |
| Immigrants | Venezuela | 9.0 /100 | #220 | Tragic $81,506 |
| Immigrants | Ghana | 9.0 /100 | #221 | Tragic $81,489 |
| Immigrants | Nigeria | 7.7 /100 | #222 | Tragic $81,236 |
| Immigrants | El Salvador | 7.6 /100 | #223 | Tragic $81,213 |
| Malaysians | 7.0 /100 | #224 | Tragic $81,064 |
| Scotch-Irish | 6.6 /100 | #225 | Tragic $80,972 |
| Immigrants | Panama | 6.2 /100 | #226 | Tragic $80,873 |
| Guyanese | 5.7 /100 | #227 | Tragic $80,734 |
| Immigrants | Bangladesh | 5.7 /100 | #228 | Tragic $80,722 |
| Delaware | 5.0 /100 | #229 | Tragic $80,527 |
| Bermudans | 4.7 /100 | #230 | Tragic $80,406 |
| Trinidadians and Tobagonians | 4.7 /100 | #231 | Tragic $80,402 |