Latvian vs Malaysian Median Household Income
COMPARE
Latvian
Malaysian
Median Household Income
Median Household Income Comparison
Latvians
Malaysians
$97,311
MEDIAN HOUSEHOLD INCOME
100.0/ 100
METRIC RATING
37th/ 347
METRIC RANK
$81,064
MEDIAN HOUSEHOLD INCOME
7.0/ 100
METRIC RATING
224th/ 347
METRIC RANK
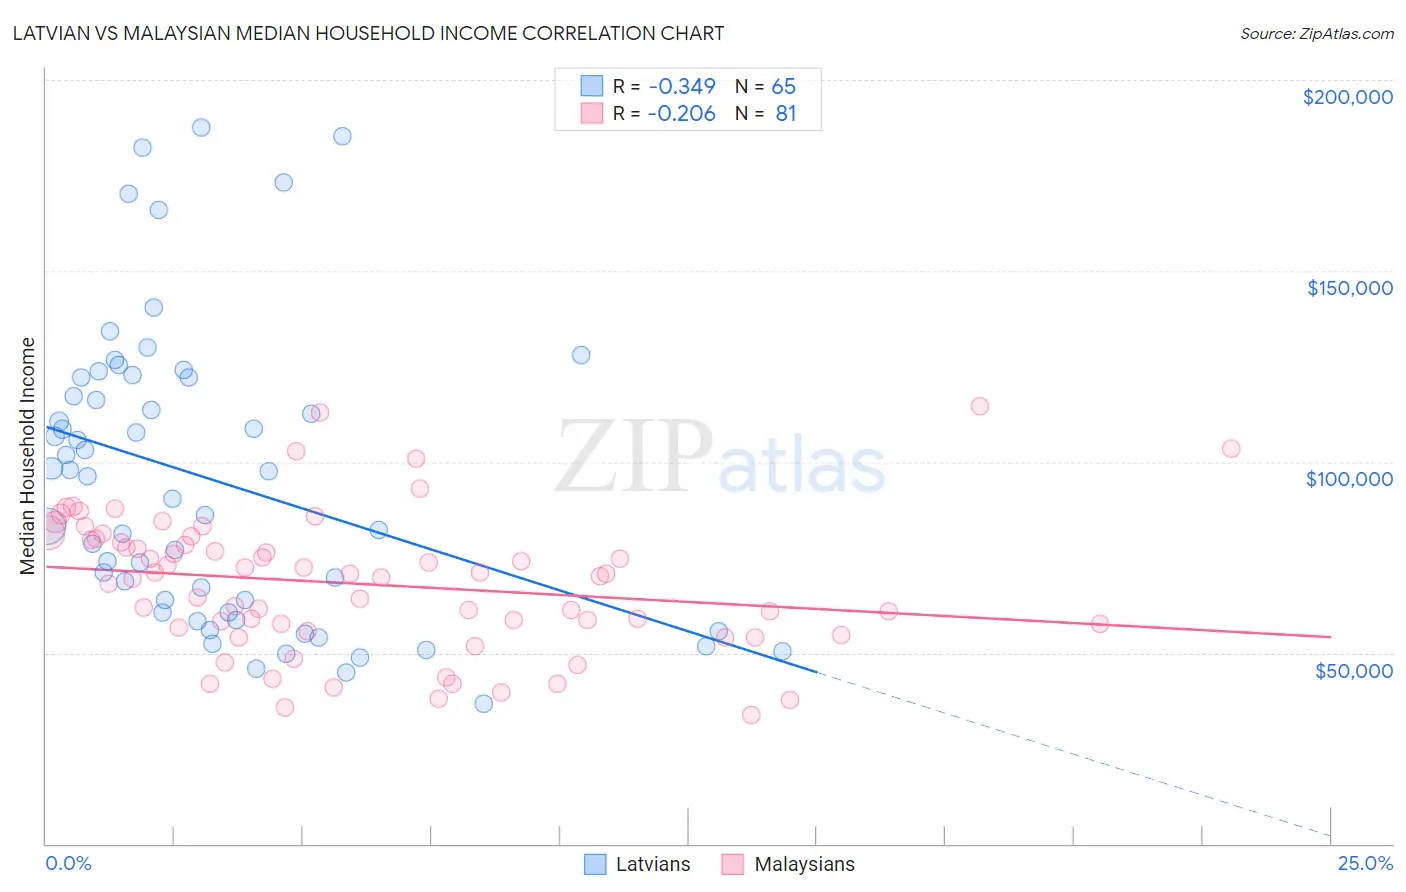
Latvian vs Malaysian Median Household Income Correlation Chart
The statistical analysis conducted on geographies consisting of 220,635,560 people shows a mild negative correlation between the proportion of Latvians and median household income in the United States with a correlation coefficient (R) of -0.349 and weighted average of $97,311. Similarly, the statistical analysis conducted on geographies consisting of 225,962,750 people shows a weak negative correlation between the proportion of Malaysians and median household income in the United States with a correlation coefficient (R) of -0.206 and weighted average of $81,064, a difference of 20.0%.
Median Household Income Correlation Summary
| Measurement | Latvian | Malaysian |
| Minimum | $36,528 | $33,804 |
| Maximum | $187,593 | $114,680 |
| Range | $151,065 | $80,876 |
| Mean | $95,169 | $68,008 |
| Median | $96,299 | $70,094 |
| Interquartile 25% (IQ1) | $60,583 | $56,150 |
| Interquartile 75% (IQ3) | $122,068 | $79,730 |
| Interquartile Range (IQR) | $61,485 | $23,581 |
| Standard Deviation (Sample) | $38,310 | $17,902 |
| Standard Deviation (Population) | $38,014 | $17,791 |
Similar Demographics by Median Household Income
Demographics Similar to Latvians by Median Household Income
In terms of median household income, the demographic groups most similar to Latvians are Immigrants from Indonesia ($97,297, a difference of 0.010%), Immigrants from Pakistan ($97,528, a difference of 0.22%), Afghan ($97,026, a difference of 0.29%), Maltese ($97,015, a difference of 0.31%), and Immigrants from Turkey ($96,964, a difference of 0.36%).
| Demographics | Rating | Rank | Median Household Income |
| Immigrants | Northern Europe | 100.0 /100 | #30 | Exceptional $99,813 |
| Turks | 100.0 /100 | #31 | Exceptional $99,389 |
| Immigrants | Denmark | 100.0 /100 | #32 | Exceptional $98,510 |
| Chinese | 100.0 /100 | #33 | Exceptional $98,496 |
| Russians | 100.0 /100 | #34 | Exceptional $98,008 |
| Immigrants | Switzerland | 100.0 /100 | #35 | Exceptional $97,979 |
| Immigrants | Pakistan | 100.0 /100 | #36 | Exceptional $97,528 |
| Latvians | 100.0 /100 | #37 | Exceptional $97,311 |
| Immigrants | Indonesia | 100.0 /100 | #38 | Exceptional $97,297 |
| Afghans | 100.0 /100 | #39 | Exceptional $97,026 |
| Maltese | 100.0 /100 | #40 | Exceptional $97,015 |
| Immigrants | Turkey | 100.0 /100 | #41 | Exceptional $96,964 |
| Immigrants | Lithuania | 99.9 /100 | #42 | Exceptional $96,836 |
| Immigrants | France | 99.9 /100 | #43 | Exceptional $96,743 |
| Immigrants | Greece | 99.9 /100 | #44 | Exceptional $96,675 |
Demographics Similar to Malaysians by Median Household Income
In terms of median household income, the demographic groups most similar to Malaysians are Scotch-Irish ($80,972, a difference of 0.11%), Immigrants from El Salvador ($81,213, a difference of 0.18%), Immigrants from Nigeria ($81,236, a difference of 0.21%), Immigrants from Panama ($80,873, a difference of 0.24%), and Guyanese ($80,734, a difference of 0.41%).
| Demographics | Rating | Rank | Median Household Income |
| Ecuadorians | 12.5 /100 | #217 | Poor $82,070 |
| Whites/Caucasians | 12.2 /100 | #218 | Poor $82,029 |
| Nigerians | 10.3 /100 | #219 | Poor $81,725 |
| Immigrants | Venezuela | 9.0 /100 | #220 | Tragic $81,506 |
| Immigrants | Ghana | 9.0 /100 | #221 | Tragic $81,489 |
| Immigrants | Nigeria | 7.7 /100 | #222 | Tragic $81,236 |
| Immigrants | El Salvador | 7.6 /100 | #223 | Tragic $81,213 |
| Malaysians | 7.0 /100 | #224 | Tragic $81,064 |
| Scotch-Irish | 6.6 /100 | #225 | Tragic $80,972 |
| Immigrants | Panama | 6.2 /100 | #226 | Tragic $80,873 |
| Guyanese | 5.7 /100 | #227 | Tragic $80,734 |
| Immigrants | Bangladesh | 5.7 /100 | #228 | Tragic $80,722 |
| Delaware | 5.0 /100 | #229 | Tragic $80,527 |
| Bermudans | 4.7 /100 | #230 | Tragic $80,406 |
| Trinidadians and Tobagonians | 4.7 /100 | #231 | Tragic $80,402 |