Immigrants from Denmark vs Welsh Median Household Income
COMPARE
Immigrants from Denmark
Welsh
Median Household Income
Median Household Income Comparison
Immigrants from Denmark
Welsh
$98,510
MEDIAN HOUSEHOLD INCOME
100.0/ 100
METRIC RATING
32nd/ 347
METRIC RANK
$83,628
MEDIAN HOUSEHOLD INCOME
28.0/ 100
METRIC RATING
192nd/ 347
METRIC RANK
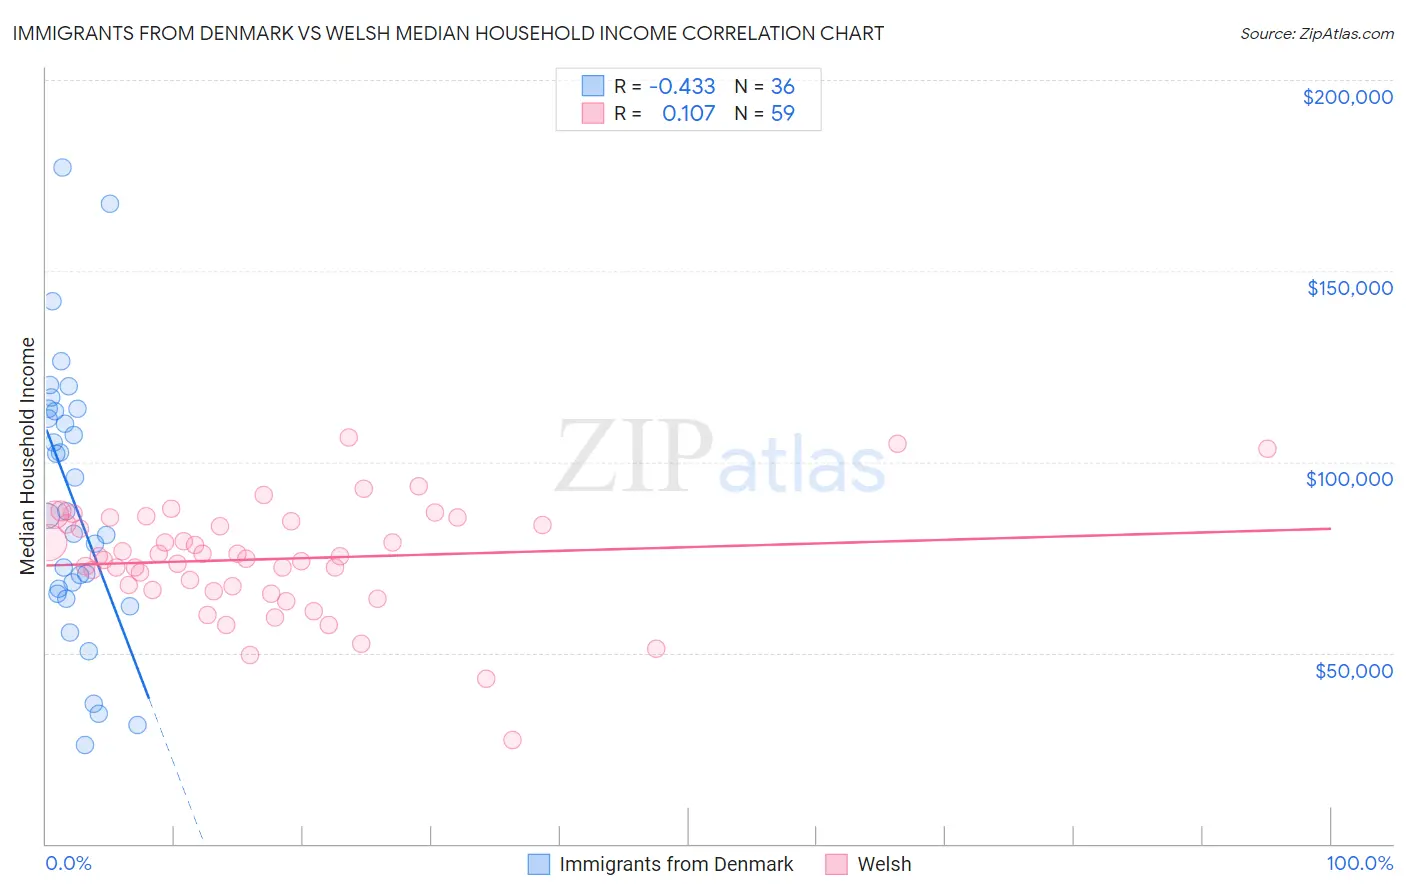
Immigrants from Denmark vs Welsh Median Household Income Correlation Chart
The statistical analysis conducted on geographies consisting of 136,400,553 people shows a moderate negative correlation between the proportion of Immigrants from Denmark and median household income in the United States with a correlation coefficient (R) of -0.433 and weighted average of $98,510. Similarly, the statistical analysis conducted on geographies consisting of 527,928,431 people shows a poor positive correlation between the proportion of Welsh and median household income in the United States with a correlation coefficient (R) of 0.107 and weighted average of $83,628, a difference of 17.8%.
Median Household Income Correlation Summary
| Measurement | Immigrants from Denmark | Welsh |
| Minimum | $26,000 | $27,188 |
| Maximum | $177,030 | $106,528 |
| Range | $151,030 | $79,340 |
| Mean | $89,771 | $74,552 |
| Median | $86,345 | $75,263 |
| Interquartile 25% (IQ1) | $66,126 | $66,384 |
| Interquartile 75% (IQ3) | $113,584 | $84,494 |
| Interquartile Range (IQR) | $47,458 | $18,110 |
| Standard Deviation (Sample) | $35,565 | $14,468 |
| Standard Deviation (Population) | $35,068 | $14,345 |
Similar Demographics by Median Household Income
Demographics Similar to Immigrants from Denmark by Median Household Income
In terms of median household income, the demographic groups most similar to Immigrants from Denmark are Chinese ($98,496, a difference of 0.010%), Russian ($98,008, a difference of 0.51%), Immigrants from Switzerland ($97,979, a difference of 0.54%), Turkish ($99,389, a difference of 0.89%), and Immigrants from Pakistan ($97,528, a difference of 1.0%).
| Demographics | Rating | Rank | Median Household Income |
| Immigrants | Sweden | 100.0 /100 | #25 | Exceptional $100,699 |
| Immigrants | Belgium | 100.0 /100 | #26 | Exceptional $100,306 |
| Bhutanese | 100.0 /100 | #27 | Exceptional $100,151 |
| Immigrants | Sri Lanka | 100.0 /100 | #28 | Exceptional $99,943 |
| Immigrants | Asia | 100.0 /100 | #29 | Exceptional $99,933 |
| Immigrants | Northern Europe | 100.0 /100 | #30 | Exceptional $99,813 |
| Turks | 100.0 /100 | #31 | Exceptional $99,389 |
| Immigrants | Denmark | 100.0 /100 | #32 | Exceptional $98,510 |
| Chinese | 100.0 /100 | #33 | Exceptional $98,496 |
| Russians | 100.0 /100 | #34 | Exceptional $98,008 |
| Immigrants | Switzerland | 100.0 /100 | #35 | Exceptional $97,979 |
| Immigrants | Pakistan | 100.0 /100 | #36 | Exceptional $97,528 |
| Latvians | 100.0 /100 | #37 | Exceptional $97,311 |
| Immigrants | Indonesia | 100.0 /100 | #38 | Exceptional $97,297 |
| Afghans | 100.0 /100 | #39 | Exceptional $97,026 |
Demographics Similar to Welsh by Median Household Income
In terms of median household income, the demographic groups most similar to Welsh are Finnish ($83,607, a difference of 0.030%), Ghanaian ($83,582, a difference of 0.060%), Immigrants from Armenia ($83,555, a difference of 0.090%), Iraqi ($83,753, a difference of 0.15%), and French ($83,468, a difference of 0.19%).
| Demographics | Rating | Rank | Median Household Income |
| Kenyans | 34.2 /100 | #185 | Fair $84,085 |
| Puget Sound Salish | 33.2 /100 | #186 | Fair $84,011 |
| Belgians | 33.2 /100 | #187 | Fair $84,008 |
| Tlingit-Haida | 32.6 /100 | #188 | Fair $83,968 |
| Immigrants | Colombia | 31.7 /100 | #189 | Fair $83,902 |
| Slovaks | 30.2 /100 | #190 | Fair $83,798 |
| Iraqis | 29.6 /100 | #191 | Fair $83,753 |
| Welsh | 28.0 /100 | #192 | Fair $83,628 |
| Finns | 27.7 /100 | #193 | Fair $83,607 |
| Ghanaians | 27.4 /100 | #194 | Fair $83,582 |
| Immigrants | Armenia | 27.0 /100 | #195 | Fair $83,555 |
| French | 26.0 /100 | #196 | Fair $83,468 |
| Aleuts | 25.7 /100 | #197 | Fair $83,446 |
| Japanese | 25.1 /100 | #198 | Fair $83,395 |
| Germans | 24.6 /100 | #199 | Fair $83,358 |