Slovene vs Welsh Median Household Income
COMPARE
Slovene
Welsh
Median Household Income
Median Household Income Comparison
Slovenes
Welsh
$85,562
MEDIAN HOUSEHOLD INCOME
57.4/ 100
METRIC RATING
172nd/ 347
METRIC RANK
$83,628
MEDIAN HOUSEHOLD INCOME
28.0/ 100
METRIC RATING
192nd/ 347
METRIC RANK
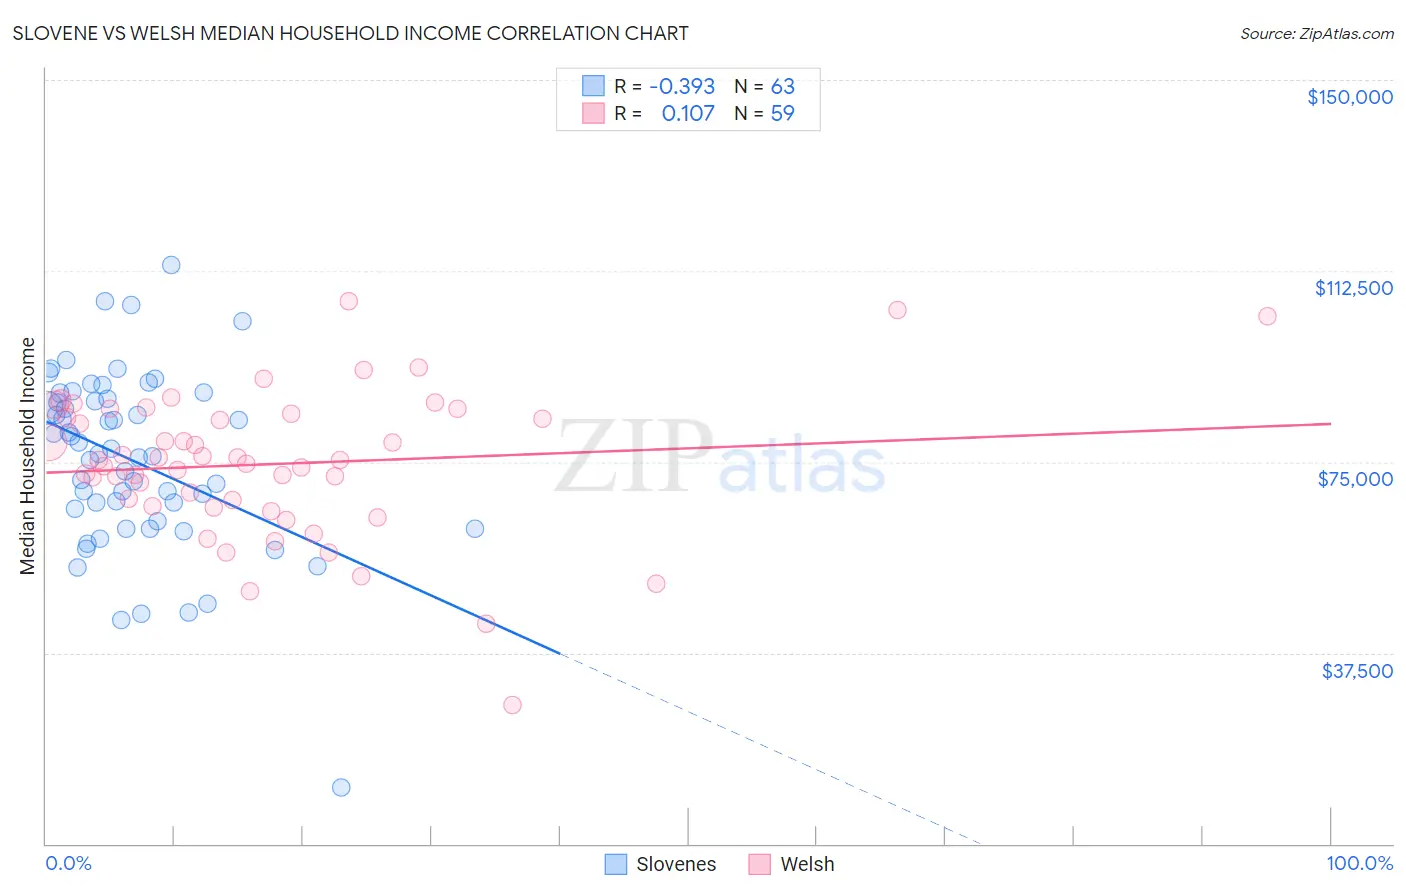
Slovene vs Welsh Median Household Income Correlation Chart
The statistical analysis conducted on geographies consisting of 261,226,883 people shows a mild negative correlation between the proportion of Slovenes and median household income in the United States with a correlation coefficient (R) of -0.393 and weighted average of $85,562. Similarly, the statistical analysis conducted on geographies consisting of 527,928,431 people shows a poor positive correlation between the proportion of Welsh and median household income in the United States with a correlation coefficient (R) of 0.107 and weighted average of $83,628, a difference of 2.3%.
Median Household Income Correlation Summary
| Measurement | Slovene | Welsh |
| Minimum | $11,161 | $27,188 |
| Maximum | $113,650 | $106,528 |
| Range | $102,489 | $79,340 |
| Mean | $75,280 | $74,552 |
| Median | $76,693 | $75,263 |
| Interquartile 25% (IQ1) | $63,438 | $66,384 |
| Interquartile 75% (IQ3) | $87,449 | $84,494 |
| Interquartile Range (IQR) | $24,011 | $18,110 |
| Standard Deviation (Sample) | $17,550 | $14,468 |
| Standard Deviation (Population) | $17,410 | $14,345 |
Demographics Similar to Slovenes and Welsh by Median Household Income
In terms of median household income, the demographic groups most similar to Slovenes are Immigrants from Cameroon ($85,314, a difference of 0.29%), Scottish ($85,101, a difference of 0.54%), Immigrants from Costa Rica ($85,054, a difference of 0.60%), Alsatian ($85,053, a difference of 0.60%), and Immigrants from Eritrea ($85,025, a difference of 0.63%). Similarly, the demographic groups most similar to Welsh are Iraqi ($83,753, a difference of 0.15%), Slovak ($83,798, a difference of 0.20%), Immigrants from Colombia ($83,902, a difference of 0.33%), Tlingit-Haida ($83,968, a difference of 0.41%), and Belgian ($84,008, a difference of 0.45%).
| Demographics | Rating | Rank | Median Household Income |
| Slovenes | 57.4 /100 | #172 | Average $85,562 |
| Immigrants | Cameroon | 53.4 /100 | #173 | Average $85,314 |
| Scottish | 50.0 /100 | #174 | Average $85,101 |
| Immigrants | Costa Rica | 49.2 /100 | #175 | Average $85,054 |
| Alsatians | 49.2 /100 | #176 | Average $85,053 |
| Immigrants | Eritrea | 48.8 /100 | #177 | Average $85,025 |
| Czechoslovakians | 47.8 /100 | #178 | Average $84,965 |
| English | 47.0 /100 | #179 | Average $84,915 |
| Immigrants | Portugal | 44.2 /100 | #180 | Average $84,740 |
| Hawaiians | 44.1 /100 | #181 | Average $84,729 |
| Uruguayans | 43.5 /100 | #182 | Average $84,691 |
| Spaniards | 42.7 /100 | #183 | Average $84,644 |
| Immigrants | Eastern Africa | 37.4 /100 | #184 | Fair $84,299 |
| Kenyans | 34.2 /100 | #185 | Fair $84,085 |
| Puget Sound Salish | 33.2 /100 | #186 | Fair $84,011 |
| Belgians | 33.2 /100 | #187 | Fair $84,008 |
| Tlingit-Haida | 32.6 /100 | #188 | Fair $83,968 |
| Immigrants | Colombia | 31.7 /100 | #189 | Fair $83,902 |
| Slovaks | 30.2 /100 | #190 | Fair $83,798 |
| Iraqis | 29.6 /100 | #191 | Fair $83,753 |
| Welsh | 28.0 /100 | #192 | Fair $83,628 |