Chickasaw vs Immigrants from Japan Median Household Income
COMPARE
Chickasaw
Immigrants from Japan
Median Household Income
Median Household Income Comparison
Chickasaw
Immigrants from Japan
$70,005
MEDIAN HOUSEHOLD INCOME
0.0/ 100
METRIC RATING
321st/ 347
METRIC RANK
$100,711
MEDIAN HOUSEHOLD INCOME
100.0/ 100
METRIC RATING
24th/ 347
METRIC RANK
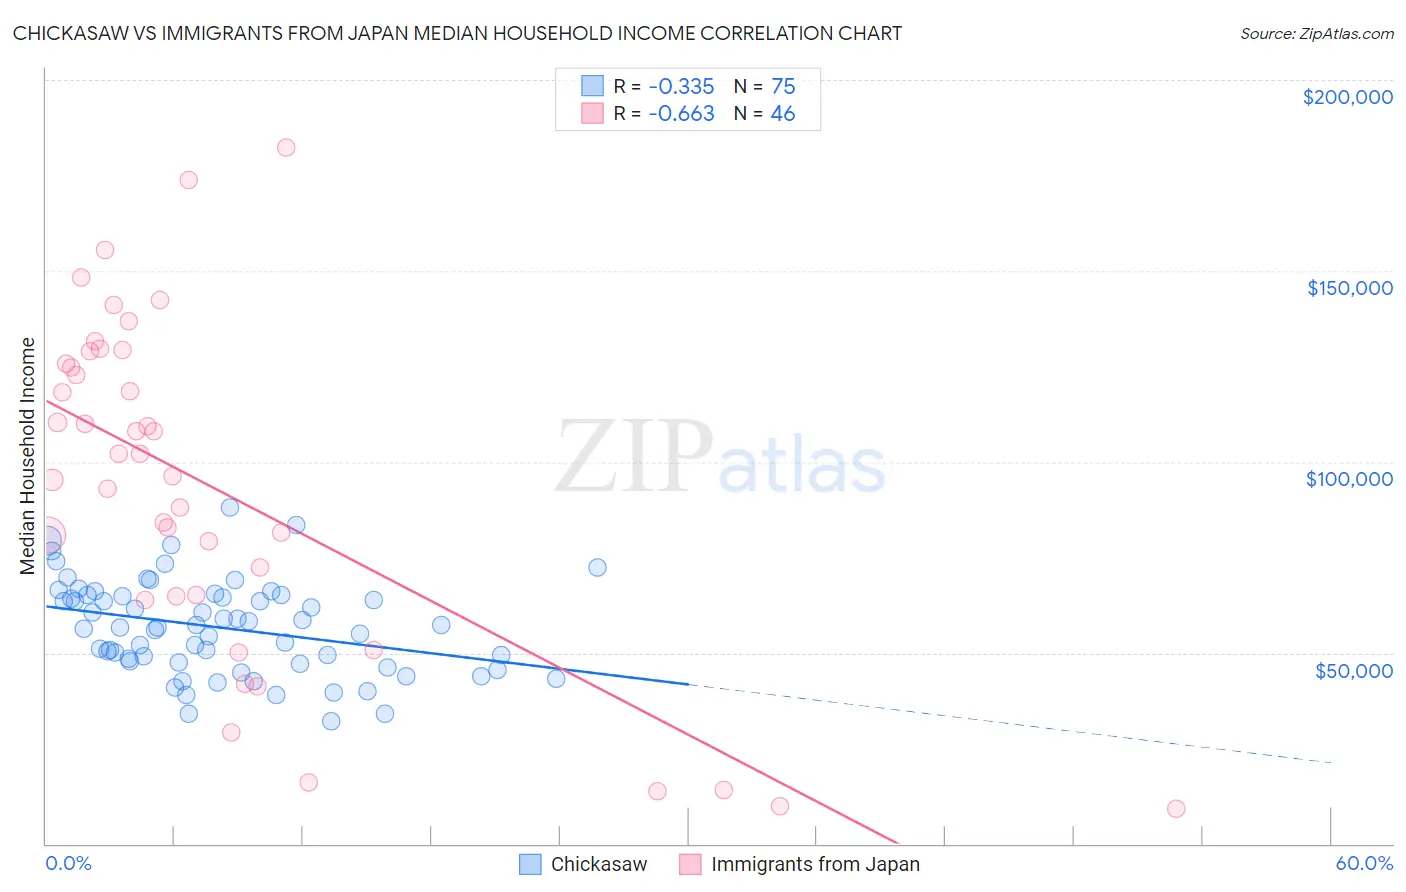
Chickasaw vs Immigrants from Japan Median Household Income Correlation Chart
The statistical analysis conducted on geographies consisting of 147,666,315 people shows a mild negative correlation between the proportion of Chickasaw and median household income in the United States with a correlation coefficient (R) of -0.335 and weighted average of $70,005. Similarly, the statistical analysis conducted on geographies consisting of 339,951,010 people shows a significant negative correlation between the proportion of Immigrants from Japan and median household income in the United States with a correlation coefficient (R) of -0.663 and weighted average of $100,711, a difference of 43.9%.
Median Household Income Correlation Summary
| Measurement | Chickasaw | Immigrants from Japan |
| Minimum | $32,063 | $9,145 |
| Maximum | $88,105 | $182,188 |
| Range | $56,042 | $173,043 |
| Mean | $56,625 | $93,083 |
| Median | $56,725 | $99,144 |
| Interquartile 25% (IQ1) | $47,447 | $64,688 |
| Interquartile 75% (IQ3) | $65,033 | $125,805 |
| Interquartile Range (IQR) | $17,586 | $61,117 |
| Standard Deviation (Sample) | $12,174 | $44,275 |
| Standard Deviation (Population) | $12,093 | $43,791 |
Similar Demographics by Median Household Income
Demographics Similar to Chickasaw by Median Household Income
In terms of median household income, the demographic groups most similar to Chickasaw are Choctaw ($69,947, a difference of 0.080%), Colville ($70,094, a difference of 0.13%), Immigrants from Dominican Republic ($70,208, a difference of 0.29%), Bahamian ($69,726, a difference of 0.40%), and Yup'ik ($69,695, a difference of 0.45%).
| Demographics | Rating | Rank | Median Household Income |
| Dominicans | 0.0 /100 | #314 | Tragic $71,302 |
| Ottawa | 0.0 /100 | #315 | Tragic $70,984 |
| Apache | 0.0 /100 | #316 | Tragic $70,927 |
| Cajuns | 0.0 /100 | #317 | Tragic $70,605 |
| Chippewa | 0.0 /100 | #318 | Tragic $70,539 |
| Immigrants | Dominican Republic | 0.0 /100 | #319 | Tragic $70,208 |
| Colville | 0.0 /100 | #320 | Tragic $70,094 |
| Chickasaw | 0.0 /100 | #321 | Tragic $70,005 |
| Choctaw | 0.0 /100 | #322 | Tragic $69,947 |
| Bahamians | 0.0 /100 | #323 | Tragic $69,726 |
| Yup'ik | 0.0 /100 | #324 | Tragic $69,695 |
| Seminole | 0.0 /100 | #325 | Tragic $69,420 |
| Yuman | 0.0 /100 | #326 | Tragic $68,743 |
| Immigrants | Cuba | 0.0 /100 | #327 | Tragic $68,461 |
| Menominee | 0.0 /100 | #328 | Tragic $68,423 |
Demographics Similar to Immigrants from Japan by Median Household Income
In terms of median household income, the demographic groups most similar to Immigrants from Japan are Immigrants from Sweden ($100,699, a difference of 0.010%), Immigrants from Belgium ($100,306, a difference of 0.40%), Bhutanese ($100,151, a difference of 0.56%), Immigrants from Bolivia ($101,394, a difference of 0.68%), and Immigrants from Sri Lanka ($99,943, a difference of 0.77%).
| Demographics | Rating | Rank | Median Household Income |
| Immigrants | Korea | 100.0 /100 | #17 | Exceptional $102,962 |
| Cypriots | 100.0 /100 | #18 | Exceptional $102,843 |
| Immigrants | Australia | 100.0 /100 | #19 | Exceptional $102,562 |
| Bolivians | 100.0 /100 | #20 | Exceptional $102,195 |
| Eastern Europeans | 100.0 /100 | #21 | Exceptional $101,781 |
| Asians | 100.0 /100 | #22 | Exceptional $101,681 |
| Immigrants | Bolivia | 100.0 /100 | #23 | Exceptional $101,394 |
| Immigrants | Japan | 100.0 /100 | #24 | Exceptional $100,711 |
| Immigrants | Sweden | 100.0 /100 | #25 | Exceptional $100,699 |
| Immigrants | Belgium | 100.0 /100 | #26 | Exceptional $100,306 |
| Bhutanese | 100.0 /100 | #27 | Exceptional $100,151 |
| Immigrants | Sri Lanka | 100.0 /100 | #28 | Exceptional $99,943 |
| Immigrants | Asia | 100.0 /100 | #29 | Exceptional $99,933 |
| Immigrants | Northern Europe | 100.0 /100 | #30 | Exceptional $99,813 |
| Turks | 100.0 /100 | #31 | Exceptional $99,389 |