Yugoslavian vs Immigrants from Japan Median Female Earnings
COMPARE
Yugoslavian
Immigrants from Japan
Median Female Earnings
Median Female Earnings Comparison
Yugoslavians
Immigrants from Japan
$38,573
MEDIAN FEMALE EARNINGS
8.8/ 100
METRIC RATING
220th/ 347
METRIC RANK
$45,323
MEDIAN FEMALE EARNINGS
100.0/ 100
METRIC RATING
20th/ 347
METRIC RANK
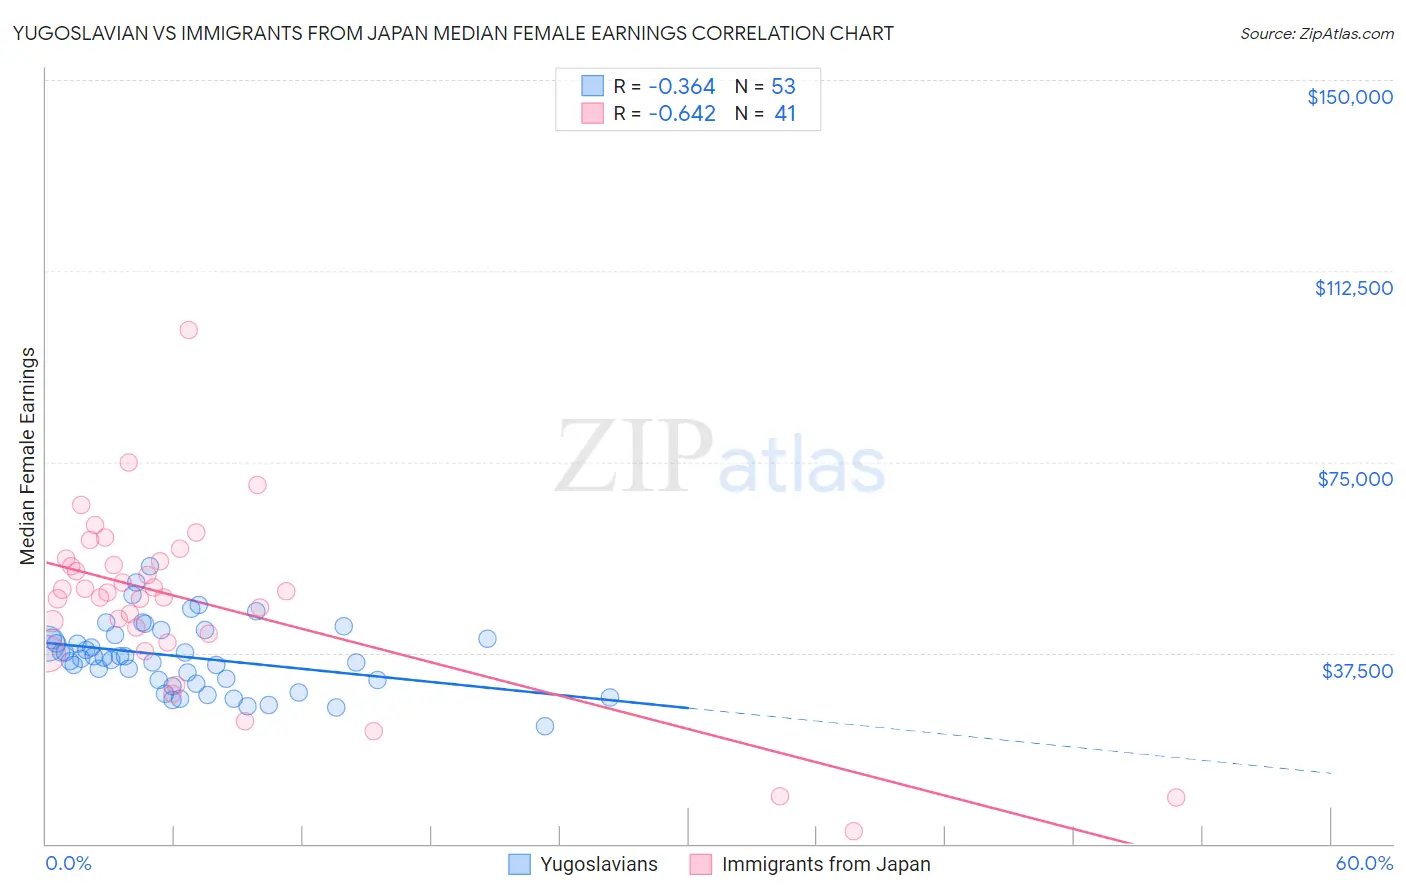
Yugoslavian vs Immigrants from Japan Median Female Earnings Correlation Chart
The statistical analysis conducted on geographies consisting of 285,638,776 people shows a mild negative correlation between the proportion of Yugoslavians and median female earnings in the United States with a correlation coefficient (R) of -0.364 and weighted average of $38,573. Similarly, the statistical analysis conducted on geographies consisting of 340,067,986 people shows a significant negative correlation between the proportion of Immigrants from Japan and median female earnings in the United States with a correlation coefficient (R) of -0.642 and weighted average of $45,323, a difference of 17.5%.
Median Female Earnings Correlation Summary
| Measurement | Yugoslavian | Immigrants from Japan |
| Minimum | $23,125 | $2,499 |
| Maximum | $54,556 | $100,821 |
| Range | $31,431 | $98,322 |
| Mean | $36,696 | $47,310 |
| Median | $36,579 | $49,462 |
| Interquartile 25% (IQ1) | $31,882 | $40,316 |
| Interquartile 75% (IQ3) | $40,715 | $55,693 |
| Interquartile Range (IQR) | $8,834 | $15,376 |
| Standard Deviation (Sample) | $6,632 | $17,852 |
| Standard Deviation (Population) | $6,570 | $17,633 |
Similar Demographics by Median Female Earnings
Demographics Similar to Yugoslavians by Median Female Earnings
In terms of median female earnings, the demographic groups most similar to Yugoslavians are Immigrants from the Azores ($38,573, a difference of 0.0%), Nepalese ($38,603, a difference of 0.080%), Cape Verdean ($38,614, a difference of 0.11%), Japanese ($38,528, a difference of 0.12%), and Immigrants from Jamaica ($38,625, a difference of 0.14%).
| Demographics | Rating | Rank | Median Female Earnings |
| Jamaicans | 10.5 /100 | #213 | Poor $38,670 |
| Iraqis | 10.5 /100 | #214 | Poor $38,666 |
| Spaniards | 10.3 /100 | #215 | Poor $38,656 |
| Immigrants | Ecuador | 10.1 /100 | #216 | Poor $38,644 |
| Immigrants | Jamaica | 9.7 /100 | #217 | Tragic $38,625 |
| Cape Verdeans | 9.5 /100 | #218 | Tragic $38,614 |
| Nepalese | 9.3 /100 | #219 | Tragic $38,603 |
| Yugoslavians | 8.8 /100 | #220 | Tragic $38,573 |
| Immigrants | Azores | 8.8 /100 | #221 | Tragic $38,573 |
| Japanese | 8.1 /100 | #222 | Tragic $38,528 |
| Immigrants | Sudan | 7.8 /100 | #223 | Tragic $38,511 |
| Native Hawaiians | 7.1 /100 | #224 | Tragic $38,461 |
| French | 7.0 /100 | #225 | Tragic $38,457 |
| French Canadians | 6.8 /100 | #226 | Tragic $38,436 |
| Scottish | 6.3 /100 | #227 | Tragic $38,397 |
Demographics Similar to Immigrants from Japan by Median Female Earnings
In terms of median female earnings, the demographic groups most similar to Immigrants from Japan are Eastern European ($45,385, a difference of 0.14%), Cypriot ($45,570, a difference of 0.55%), Cambodian ($45,014, a difference of 0.69%), Immigrants from Greece ($44,976, a difference of 0.77%), and Burmese ($44,911, a difference of 0.92%).
| Demographics | Rating | Rank | Median Female Earnings |
| Immigrants | Australia | 100.0 /100 | #13 | Exceptional $46,573 |
| Soviet Union | 100.0 /100 | #14 | Exceptional $46,556 |
| Immigrants | Eastern Asia | 100.0 /100 | #15 | Exceptional $46,502 |
| Indians (Asian) | 100.0 /100 | #16 | Exceptional $46,481 |
| Immigrants | South Central Asia | 100.0 /100 | #17 | Exceptional $46,324 |
| Cypriots | 100.0 /100 | #18 | Exceptional $45,570 |
| Eastern Europeans | 100.0 /100 | #19 | Exceptional $45,385 |
| Immigrants | Japan | 100.0 /100 | #20 | Exceptional $45,323 |
| Cambodians | 100.0 /100 | #21 | Exceptional $45,014 |
| Immigrants | Greece | 100.0 /100 | #22 | Exceptional $44,976 |
| Burmese | 100.0 /100 | #23 | Exceptional $44,911 |
| Immigrants | Korea | 100.0 /100 | #24 | Exceptional $44,847 |
| Immigrants | Sweden | 100.0 /100 | #25 | Exceptional $44,774 |
| Immigrants | Belarus | 100.0 /100 | #26 | Exceptional $44,757 |
| Turks | 100.0 /100 | #27 | Exceptional $44,695 |