Yaqui vs Thai In Labor Force | Age 20-64
COMPARE
Yaqui
Thai
In Labor Force | Age 20-64
In Labor Force | Age 20-64 Comparison
Yaqui
Thais
76.5%
IN LABOR FORCE | AGE 20-64
0.0/ 100
METRIC RATING
316th/ 347
METRIC RANK
80.9%
IN LABOR FORCE | AGE 20-64
100.0/ 100
METRIC RATING
20th/ 347
METRIC RANK
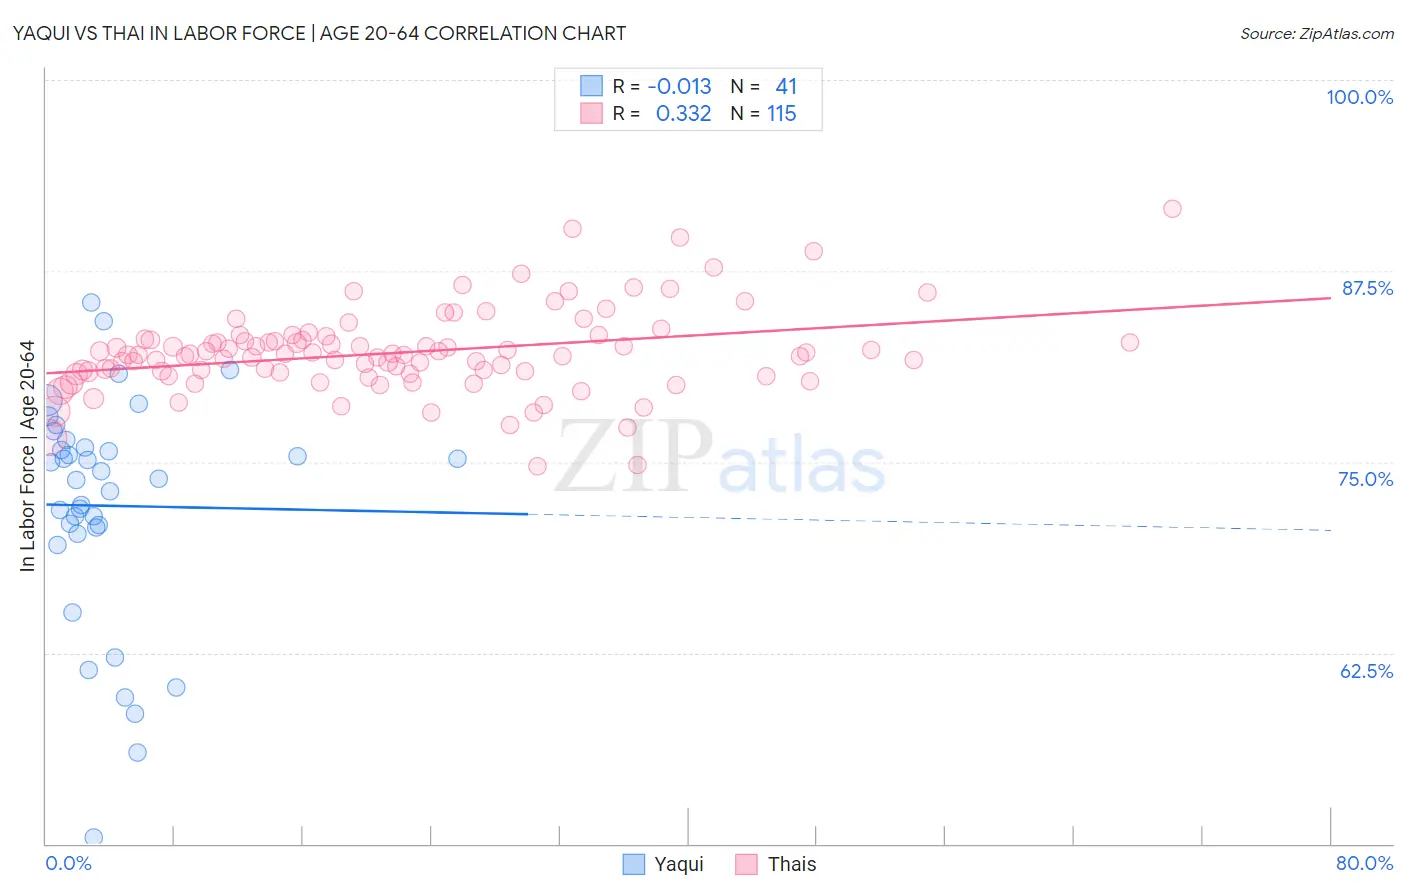
Yaqui vs Thai In Labor Force | Age 20-64 Correlation Chart
The statistical analysis conducted on geographies consisting of 107,721,250 people shows no correlation between the proportion of Yaqui and labor force participation rate among population between the ages 20 and 64 in the United States with a correlation coefficient (R) of -0.013 and weighted average of 76.5%. Similarly, the statistical analysis conducted on geographies consisting of 475,903,874 people shows a mild positive correlation between the proportion of Thais and labor force participation rate among population between the ages 20 and 64 in the United States with a correlation coefficient (R) of 0.332 and weighted average of 80.9%, a difference of 5.7%.
In Labor Force | Age 20-64 Correlation Summary
| Measurement | Yaqui | Thai |
| Minimum | 50.4% | 74.7% |
| Maximum | 85.4% | 91.6% |
| Range | 35.0% | 16.9% |
| Mean | 72.1% | 82.2% |
| Median | 73.9% | 82.0% |
| Interquartile 25% (IQ1) | 70.5% | 80.7% |
| Interquartile 75% (IQ3) | 76.2% | 83.0% |
| Interquartile Range (IQR) | 5.7% | 2.2% |
| Standard Deviation (Sample) | 7.5% | 2.8% |
| Standard Deviation (Population) | 7.5% | 2.7% |
Similar Demographics by In Labor Force | Age 20-64
Demographics Similar to Yaqui by In Labor Force | Age 20-64
In terms of in labor force | age 20-64, the demographic groups most similar to Yaqui are Ottawa (76.7%, a difference of 0.19%), Black/African American (76.8%, a difference of 0.29%), Shoshone (76.8%, a difference of 0.31%), Cherokee (76.2%, a difference of 0.40%), and Alaskan Athabascan (76.9%, a difference of 0.43%).
| Demographics | Rating | Rank | In Labor Force | Age 20-64 |
| Americans | 0.0 /100 | #309 | Tragic 77.0% |
| Comanche | 0.0 /100 | #310 | Tragic 77.0% |
| Blackfeet | 0.0 /100 | #311 | Tragic 77.0% |
| Alaskan Athabascans | 0.0 /100 | #312 | Tragic 76.9% |
| Shoshone | 0.0 /100 | #313 | Tragic 76.8% |
| Blacks/African Americans | 0.0 /100 | #314 | Tragic 76.8% |
| Ottawa | 0.0 /100 | #315 | Tragic 76.7% |
| Yaqui | 0.0 /100 | #316 | Tragic 76.5% |
| Cherokee | 0.0 /100 | #317 | Tragic 76.2% |
| Chickasaw | 0.0 /100 | #318 | Tragic 76.2% |
| Inupiat | 0.0 /100 | #319 | Tragic 76.1% |
| Yakama | 0.0 /100 | #320 | Tragic 75.8% |
| Seminole | 0.0 /100 | #321 | Tragic 75.5% |
| Dutch West Indians | 0.0 /100 | #322 | Tragic 75.5% |
| Cajuns | 0.0 /100 | #323 | Tragic 75.5% |
Demographics Similar to Thais by In Labor Force | Age 20-64
In terms of in labor force | age 20-64, the demographic groups most similar to Thais are Liberian (80.9%, a difference of 0.020%), Zimbabwean (81.0%, a difference of 0.050%), Immigrants from Bulgaria (81.0%, a difference of 0.060%), Norwegian (81.0%, a difference of 0.070%), and Sudanese (80.8%, a difference of 0.090%).
| Demographics | Rating | Rank | In Labor Force | Age 20-64 |
| Immigrants | India | 100.0 /100 | #13 | Exceptional 81.3% |
| Cambodians | 100.0 /100 | #14 | Exceptional 81.1% |
| Bulgarians | 100.0 /100 | #15 | Exceptional 81.1% |
| Immigrants | Nepal | 100.0 /100 | #16 | Exceptional 81.1% |
| Norwegians | 100.0 /100 | #17 | Exceptional 81.0% |
| Immigrants | Bulgaria | 100.0 /100 | #18 | Exceptional 81.0% |
| Zimbabweans | 100.0 /100 | #19 | Exceptional 81.0% |
| Thais | 100.0 /100 | #20 | Exceptional 80.9% |
| Liberians | 100.0 /100 | #21 | Exceptional 80.9% |
| Sudanese | 100.0 /100 | #22 | Exceptional 80.8% |
| Immigrants | Bosnia and Herzegovina | 100.0 /100 | #23 | Exceptional 80.8% |
| Immigrants | Morocco | 100.0 /100 | #24 | Exceptional 80.8% |
| Kenyans | 100.0 /100 | #25 | Exceptional 80.8% |
| Immigrants | Serbia | 100.0 /100 | #26 | Exceptional 80.8% |
| Immigrants | Kenya | 99.9 /100 | #27 | Exceptional 80.7% |