Yakama vs Swedish Median Female Earnings
COMPARE
Yakama
Swedish
Median Female Earnings
Median Female Earnings Comparison
Yakama
Swedes
$33,354
MEDIAN FEMALE EARNINGS
0.0/ 100
METRIC RATING
337th/ 347
METRIC RANK
$39,421
MEDIAN FEMALE EARNINGS
36.0/ 100
METRIC RATING
187th/ 347
METRIC RANK
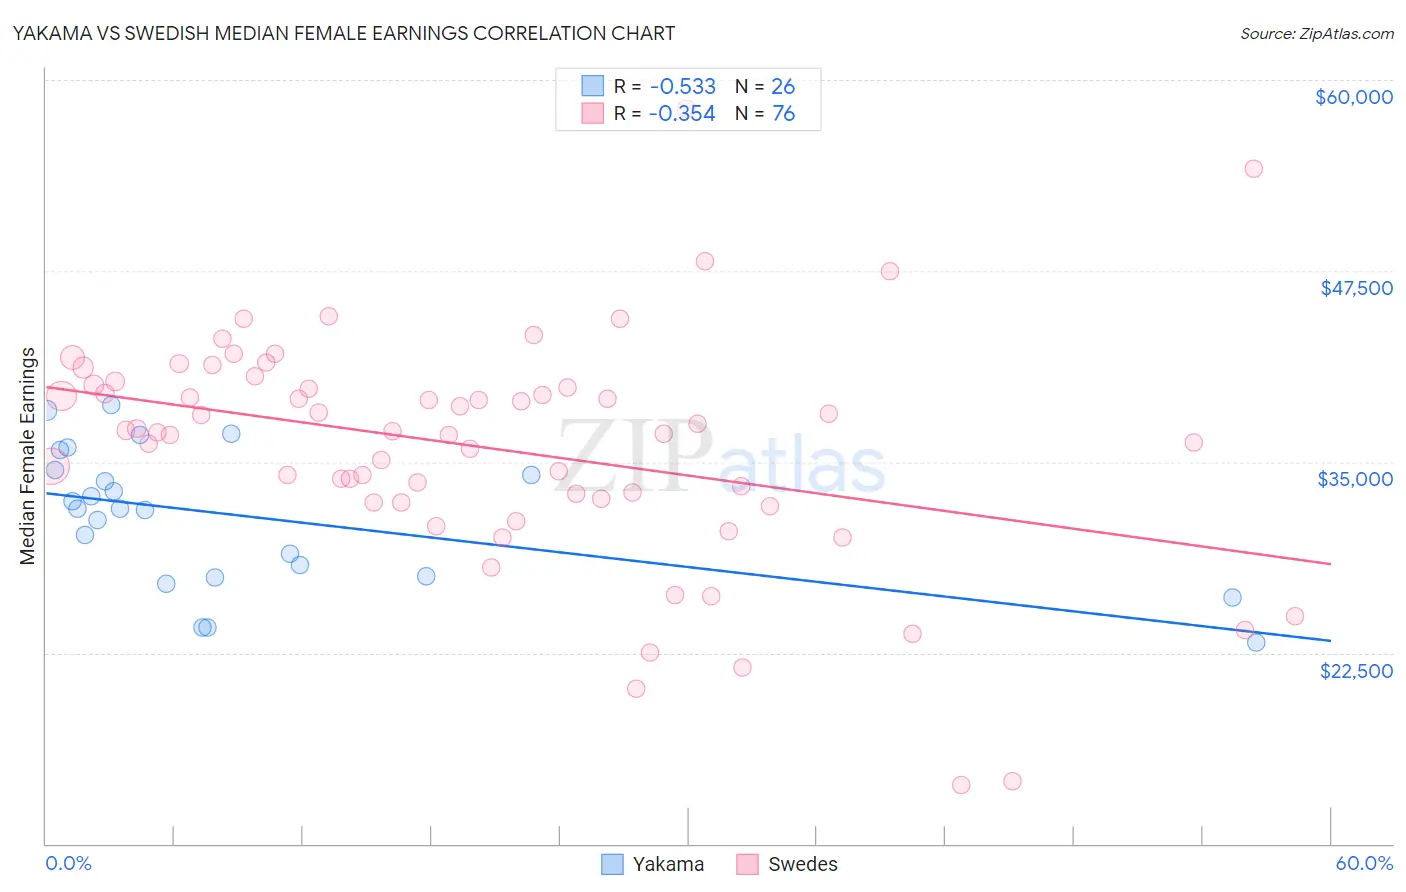
Yakama vs Swedish Median Female Earnings Correlation Chart
The statistical analysis conducted on geographies consisting of 19,910,730 people shows a substantial negative correlation between the proportion of Yakama and median female earnings in the United States with a correlation coefficient (R) of -0.533 and weighted average of $33,354. Similarly, the statistical analysis conducted on geographies consisting of 538,112,894 people shows a mild negative correlation between the proportion of Swedes and median female earnings in the United States with a correlation coefficient (R) of -0.354 and weighted average of $39,421, a difference of 18.2%.
Median Female Earnings Correlation Summary
| Measurement | Yakama | Swedish |
| Minimum | $23,214 | $13,839 |
| Maximum | $38,750 | $58,087 |
| Range | $15,536 | $44,248 |
| Mean | $31,429 | $35,925 |
| Median | $31,931 | $36,993 |
| Interquartile 25% (IQ1) | $27,516 | $32,470 |
| Interquartile 75% (IQ3) | $34,456 | $39,982 |
| Interquartile Range (IQR) | $6,940 | $7,512 |
| Standard Deviation (Sample) | $4,456 | $7,648 |
| Standard Deviation (Population) | $4,370 | $7,597 |
Similar Demographics by Median Female Earnings
Demographics Similar to Yakama by Median Female Earnings
In terms of median female earnings, the demographic groups most similar to Yakama are Ottawa ($33,378, a difference of 0.070%), Immigrants from Cuba ($33,291, a difference of 0.19%), Creek ($33,437, a difference of 0.25%), Immigrants from Mexico ($33,236, a difference of 0.36%), and Tohono O'odham ($33,205, a difference of 0.45%).
| Demographics | Rating | Rank | Median Female Earnings |
| Menominee | 0.0 /100 | #330 | Tragic $33,894 |
| Natives/Alaskans | 0.0 /100 | #331 | Tragic $33,806 |
| Choctaw | 0.0 /100 | #332 | Tragic $33,775 |
| Mexicans | 0.0 /100 | #333 | Tragic $33,664 |
| Spanish American Indians | 0.0 /100 | #334 | Tragic $33,625 |
| Creek | 0.0 /100 | #335 | Tragic $33,437 |
| Ottawa | 0.0 /100 | #336 | Tragic $33,378 |
| Yakama | 0.0 /100 | #337 | Tragic $33,354 |
| Immigrants | Cuba | 0.0 /100 | #338 | Tragic $33,291 |
| Immigrants | Mexico | 0.0 /100 | #339 | Tragic $33,236 |
| Tohono O'odham | 0.0 /100 | #340 | Tragic $33,205 |
| Navajo | 0.0 /100 | #341 | Tragic $33,046 |
| Yup'ik | 0.0 /100 | #342 | Tragic $32,730 |
| Pueblo | 0.0 /100 | #343 | Tragic $32,564 |
| Lumbee | 0.0 /100 | #344 | Tragic $32,500 |
Demographics Similar to Swedes by Median Female Earnings
In terms of median female earnings, the demographic groups most similar to Swedes are Bermudan ($39,418, a difference of 0.010%), Immigrants from West Indies ($39,441, a difference of 0.050%), Colombian ($39,439, a difference of 0.050%), European ($39,457, a difference of 0.090%), and Senegalese ($39,384, a difference of 0.090%).
| Demographics | Rating | Rank | Median Female Earnings |
| Immigrants | Kenya | 41.6 /100 | #180 | Average $39,535 |
| Tsimshian | 41.4 /100 | #181 | Average $39,530 |
| Tlingit-Haida | 40.5 /100 | #182 | Average $39,513 |
| Hungarians | 40.3 /100 | #183 | Average $39,510 |
| Europeans | 37.7 /100 | #184 | Fair $39,457 |
| Immigrants | West Indies | 36.9 /100 | #185 | Fair $39,441 |
| Colombians | 36.9 /100 | #186 | Fair $39,439 |
| Swedes | 36.0 /100 | #187 | Fair $39,421 |
| Bermudans | 35.9 /100 | #188 | Fair $39,418 |
| Senegalese | 34.2 /100 | #189 | Fair $39,384 |
| Puget Sound Salish | 33.9 /100 | #190 | Fair $39,376 |
| Immigrants | Western Africa | 32.7 /100 | #191 | Fair $39,351 |
| Immigrants | Immigrants | 31.7 /100 | #192 | Fair $39,328 |
| Immigrants | Nigeria | 30.2 /100 | #193 | Fair $39,294 |
| Irish | 30.0 /100 | #194 | Fair $39,291 |