Yakama vs Sioux Median Female Earnings
COMPARE
Yakama
Sioux
Median Female Earnings
Median Female Earnings Comparison
Yakama
Sioux
$33,354
MEDIAN FEMALE EARNINGS
0.0/ 100
METRIC RATING
337th/ 347
METRIC RANK
$35,063
MEDIAN FEMALE EARNINGS
0.0/ 100
METRIC RATING
307th/ 347
METRIC RANK
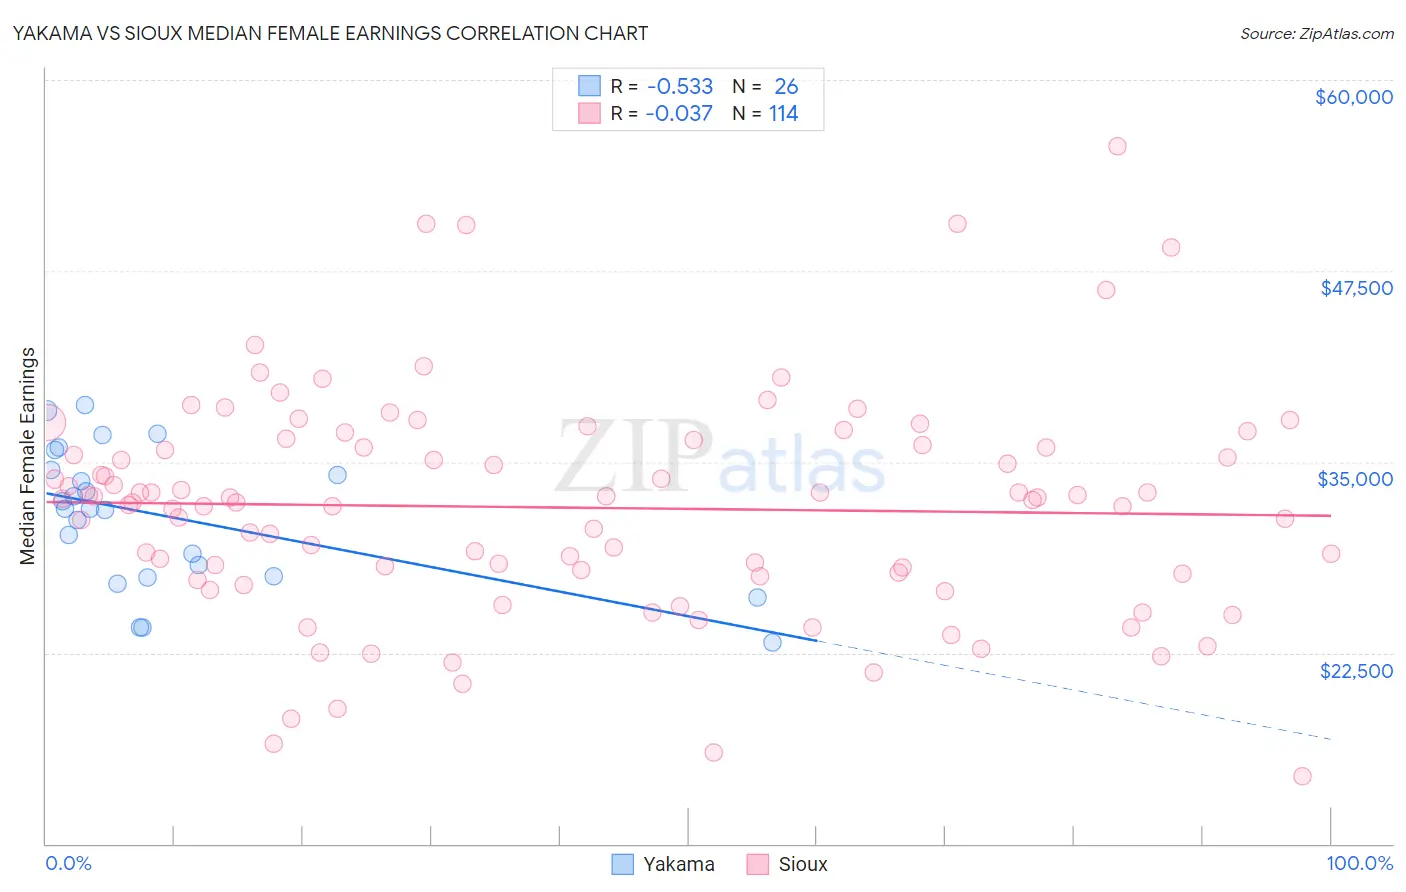
Yakama vs Sioux Median Female Earnings Correlation Chart
The statistical analysis conducted on geographies consisting of 19,910,730 people shows a substantial negative correlation between the proportion of Yakama and median female earnings in the United States with a correlation coefficient (R) of -0.533 and weighted average of $33,354. Similarly, the statistical analysis conducted on geographies consisting of 234,051,020 people shows no correlation between the proportion of Sioux and median female earnings in the United States with a correlation coefficient (R) of -0.037 and weighted average of $35,063, a difference of 5.1%.
Median Female Earnings Correlation Summary
| Measurement | Yakama | Sioux |
| Minimum | $23,214 | $14,387 |
| Maximum | $38,750 | $55,625 |
| Range | $15,536 | $41,238 |
| Mean | $31,429 | $32,005 |
| Median | $31,931 | $32,537 |
| Interquartile 25% (IQ1) | $27,516 | $27,692 |
| Interquartile 75% (IQ3) | $34,456 | $36,094 |
| Interquartile Range (IQR) | $6,940 | $8,402 |
| Standard Deviation (Sample) | $4,456 | $7,319 |
| Standard Deviation (Population) | $4,370 | $7,287 |
Similar Demographics by Median Female Earnings
Demographics Similar to Yakama by Median Female Earnings
In terms of median female earnings, the demographic groups most similar to Yakama are Ottawa ($33,378, a difference of 0.070%), Immigrants from Cuba ($33,291, a difference of 0.19%), Creek ($33,437, a difference of 0.25%), Immigrants from Mexico ($33,236, a difference of 0.36%), and Tohono O'odham ($33,205, a difference of 0.45%).
| Demographics | Rating | Rank | Median Female Earnings |
| Menominee | 0.0 /100 | #330 | Tragic $33,894 |
| Natives/Alaskans | 0.0 /100 | #331 | Tragic $33,806 |
| Choctaw | 0.0 /100 | #332 | Tragic $33,775 |
| Mexicans | 0.0 /100 | #333 | Tragic $33,664 |
| Spanish American Indians | 0.0 /100 | #334 | Tragic $33,625 |
| Creek | 0.0 /100 | #335 | Tragic $33,437 |
| Ottawa | 0.0 /100 | #336 | Tragic $33,378 |
| Yakama | 0.0 /100 | #337 | Tragic $33,354 |
| Immigrants | Cuba | 0.0 /100 | #338 | Tragic $33,291 |
| Immigrants | Mexico | 0.0 /100 | #339 | Tragic $33,236 |
| Tohono O'odham | 0.0 /100 | #340 | Tragic $33,205 |
| Navajo | 0.0 /100 | #341 | Tragic $33,046 |
| Yup'ik | 0.0 /100 | #342 | Tragic $32,730 |
| Pueblo | 0.0 /100 | #343 | Tragic $32,564 |
| Lumbee | 0.0 /100 | #344 | Tragic $32,500 |
Demographics Similar to Sioux by Median Female Earnings
In terms of median female earnings, the demographic groups most similar to Sioux are Immigrants from Bahamas ($35,027, a difference of 0.10%), Honduran ($35,013, a difference of 0.14%), Fijian ($35,114, a difference of 0.15%), Chippewa ($35,003, a difference of 0.17%), and Bahamian ($35,125, a difference of 0.18%).
| Demographics | Rating | Rank | Median Female Earnings |
| Yuman | 0.0 /100 | #300 | Tragic $35,377 |
| Pima | 0.0 /100 | #301 | Tragic $35,326 |
| Blacks/African Americans | 0.0 /100 | #302 | Tragic $35,315 |
| Immigrants | Latin America | 0.0 /100 | #303 | Tragic $35,307 |
| Crow | 0.0 /100 | #304 | Tragic $35,266 |
| Bahamians | 0.0 /100 | #305 | Tragic $35,125 |
| Fijians | 0.0 /100 | #306 | Tragic $35,114 |
| Sioux | 0.0 /100 | #307 | Tragic $35,063 |
| Immigrants | Bahamas | 0.0 /100 | #308 | Tragic $35,027 |
| Hondurans | 0.0 /100 | #309 | Tragic $35,013 |
| Chippewa | 0.0 /100 | #310 | Tragic $35,003 |
| Ute | 0.0 /100 | #311 | Tragic $34,960 |
| Yaqui | 0.0 /100 | #312 | Tragic $34,943 |
| Cubans | 0.0 /100 | #313 | Tragic $34,942 |
| Apache | 0.0 /100 | #314 | Tragic $34,895 |