Yakama vs Immigrants from Germany Median Family Income
COMPARE
Yakama
Immigrants from Germany
Median Family Income
Median Family Income Comparison
Yakama
Immigrants from Germany
$83,932
MEDIAN FAMILY INCOME
0.0/ 100
METRIC RATING
317th/ 347
METRIC RANK
$105,507
MEDIAN FAMILY INCOME
80.9/ 100
METRIC RATING
149th/ 347
METRIC RANK
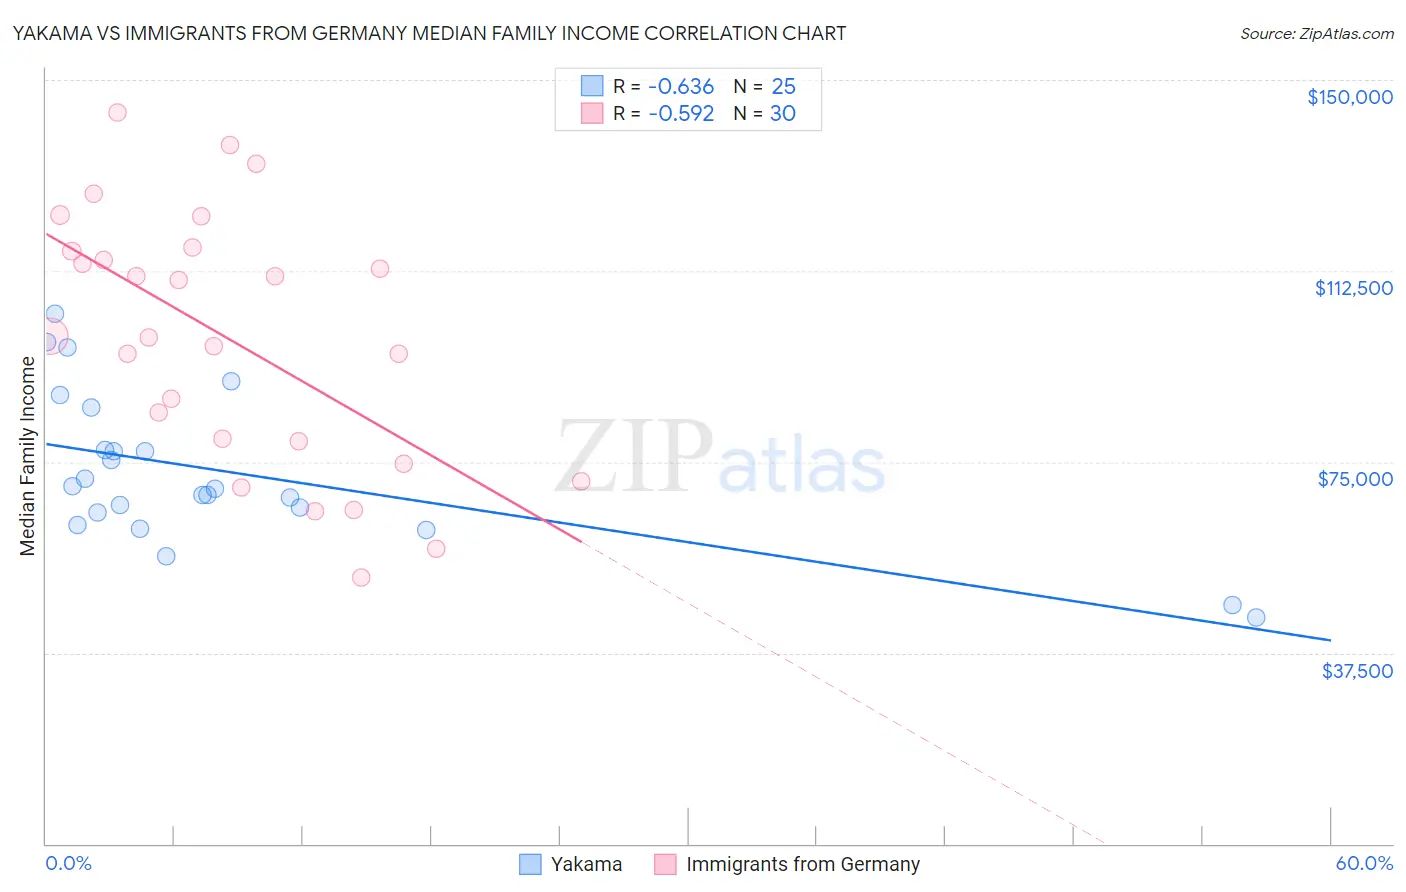
Yakama vs Immigrants from Germany Median Family Income Correlation Chart
The statistical analysis conducted on geographies consisting of 19,915,987 people shows a significant negative correlation between the proportion of Yakama and median family income in the United States with a correlation coefficient (R) of -0.636 and weighted average of $83,932. Similarly, the statistical analysis conducted on geographies consisting of 463,646,337 people shows a substantial negative correlation between the proportion of Immigrants from Germany and median family income in the United States with a correlation coefficient (R) of -0.592 and weighted average of $105,507, a difference of 25.7%.
Median Family Income Correlation Summary
| Measurement | Yakama | Immigrants from Germany |
| Minimum | $44,375 | $52,386 |
| Maximum | $103,973 | $143,516 |
| Range | $59,598 | $91,130 |
| Mean | $72,774 | $99,149 |
| Median | $69,699 | $99,484 |
| Interquartile 25% (IQ1) | $63,837 | $79,167 |
| Interquartile 75% (IQ3) | $81,474 | $116,480 |
| Interquartile Range (IQR) | $17,637 | $37,313 |
| Standard Deviation (Sample) | $14,936 | $24,798 |
| Standard Deviation (Population) | $14,634 | $24,381 |
Similar Demographics by Median Family Income
Demographics Similar to Yakama by Median Family Income
In terms of median family income, the demographic groups most similar to Yakama are Immigrants from Haiti ($84,018, a difference of 0.10%), Immigrants from Mexico ($83,639, a difference of 0.35%), Immigrants from Honduras ($83,618, a difference of 0.38%), Apache ($84,451, a difference of 0.62%), and Seminole ($83,354, a difference of 0.69%).
| Demographics | Rating | Rank | Median Family Income |
| Immigrants | Central America | 0.0 /100 | #310 | Tragic $85,050 |
| Hondurans | 0.0 /100 | #311 | Tragic $85,004 |
| Cubans | 0.0 /100 | #312 | Tragic $84,981 |
| Choctaw | 0.0 /100 | #313 | Tragic $84,835 |
| Immigrants | Bahamas | 0.0 /100 | #314 | Tragic $84,732 |
| Apache | 0.0 /100 | #315 | Tragic $84,451 |
| Immigrants | Haiti | 0.0 /100 | #316 | Tragic $84,018 |
| Yakama | 0.0 /100 | #317 | Tragic $83,932 |
| Immigrants | Mexico | 0.0 /100 | #318 | Tragic $83,639 |
| Immigrants | Honduras | 0.0 /100 | #319 | Tragic $83,618 |
| Seminole | 0.0 /100 | #320 | Tragic $83,354 |
| Immigrants | Caribbean | 0.0 /100 | #321 | Tragic $83,319 |
| Dominicans | 0.0 /100 | #322 | Tragic $82,888 |
| Bahamians | 0.0 /100 | #323 | Tragic $82,631 |
| Creek | 0.0 /100 | #324 | Tragic $82,560 |
Demographics Similar to Immigrants from Germany by Median Family Income
In terms of median family income, the demographic groups most similar to Immigrants from Germany are Irish ($105,453, a difference of 0.050%), Peruvian ($105,444, a difference of 0.060%), Hungarian ($105,609, a difference of 0.10%), Immigrants from Chile ($105,655, a difference of 0.14%), and Immigrants from Albania ($105,285, a difference of 0.21%).
| Demographics | Rating | Rank | Median Family Income |
| Slovenes | 84.7 /100 | #142 | Excellent $106,020 |
| Tongans | 84.3 /100 | #143 | Excellent $105,967 |
| Immigrants | Morocco | 84.3 /100 | #144 | Excellent $105,964 |
| Danes | 83.8 /100 | #145 | Excellent $105,900 |
| Czechs | 83.4 /100 | #146 | Excellent $105,839 |
| Immigrants | Chile | 82.1 /100 | #147 | Excellent $105,655 |
| Hungarians | 81.7 /100 | #148 | Excellent $105,609 |
| Immigrants | Germany | 80.9 /100 | #149 | Excellent $105,507 |
| Irish | 80.5 /100 | #150 | Excellent $105,453 |
| Peruvians | 80.4 /100 | #151 | Excellent $105,444 |
| Immigrants | Albania | 79.1 /100 | #152 | Good $105,285 |
| Slavs | 77.9 /100 | #153 | Good $105,144 |
| Immigrants | Nepal | 76.3 /100 | #154 | Good $104,966 |
| Native Hawaiians | 75.8 /100 | #155 | Good $104,910 |
| Basques | 74.4 /100 | #156 | Good $104,760 |