Immigrants from Sri Lanka vs Immigrants from Germany Median Household Income
COMPARE
Immigrants from Sri Lanka
Immigrants from Germany
Median Household Income
Median Household Income Comparison
Immigrants from Sri Lanka
Immigrants from Germany
$99,943
MEDIAN HOUSEHOLD INCOME
100.0/ 100
METRIC RATING
28th/ 347
METRIC RANK
$86,764
MEDIAN HOUSEHOLD INCOME
74.4/ 100
METRIC RATING
154th/ 347
METRIC RANK
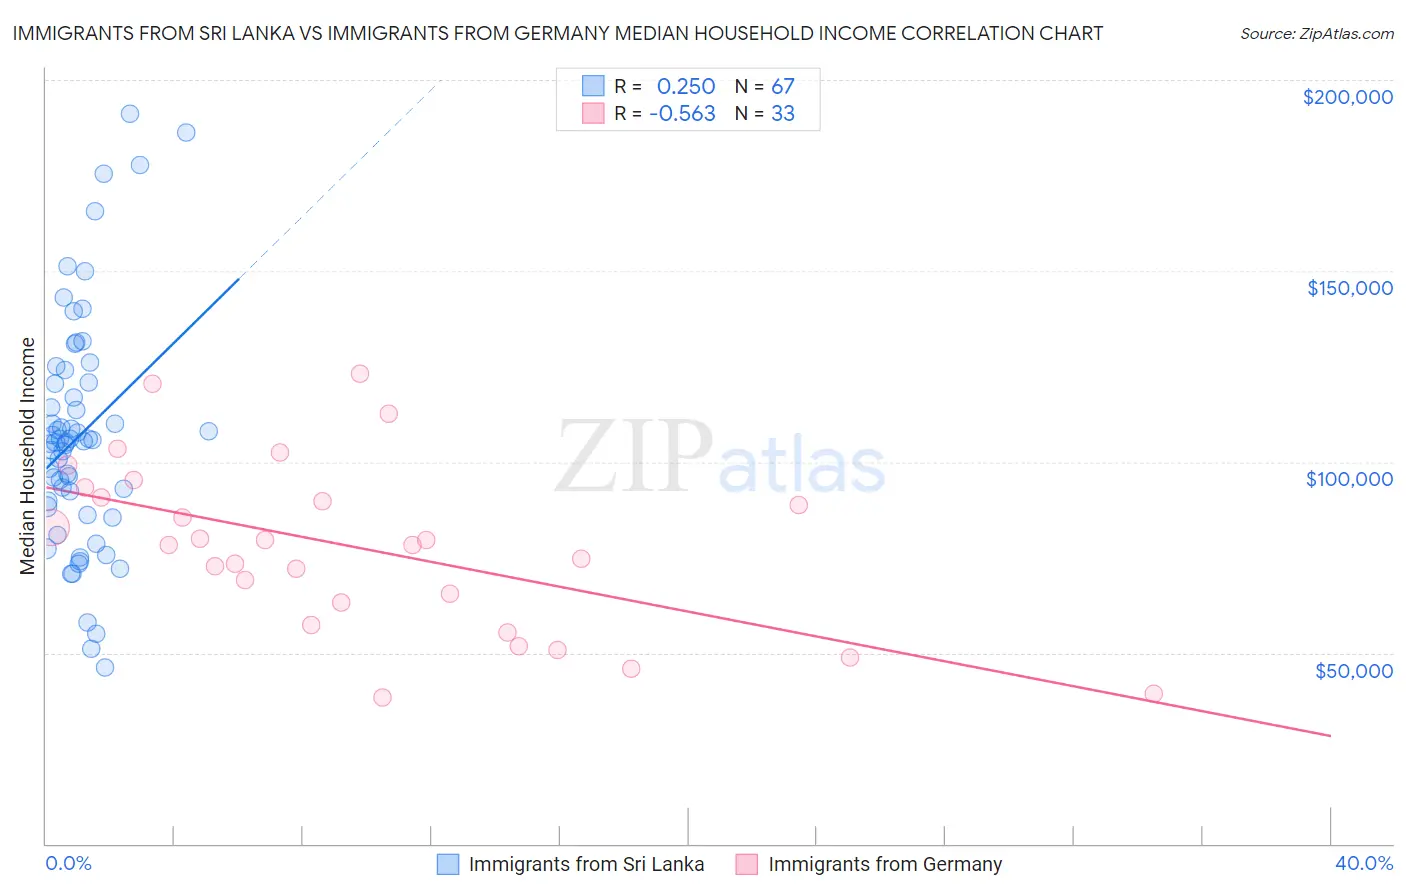
Immigrants from Sri Lanka vs Immigrants from Germany Median Household Income Correlation Chart
The statistical analysis conducted on geographies consisting of 149,648,096 people shows a weak positive correlation between the proportion of Immigrants from Sri Lanka and median household income in the United States with a correlation coefficient (R) of 0.250 and weighted average of $99,943. Similarly, the statistical analysis conducted on geographies consisting of 463,670,643 people shows a substantial negative correlation between the proportion of Immigrants from Germany and median household income in the United States with a correlation coefficient (R) of -0.563 and weighted average of $86,764, a difference of 15.2%.
Median Household Income Correlation Summary
| Measurement | Immigrants from Sri Lanka | Immigrants from Germany |
| Minimum | $46,012 | $38,452 |
| Maximum | $191,184 | $123,192 |
| Range | $145,172 | $84,740 |
| Mean | $106,967 | $77,580 |
| Median | $105,523 | $78,375 |
| Interquartile 25% (IQ1) | $88,285 | $60,226 |
| Interquartile 75% (IQ3) | $120,784 | $92,055 |
| Interquartile Range (IQR) | $32,499 | $31,829 |
| Standard Deviation (Sample) | $30,723 | $22,106 |
| Standard Deviation (Population) | $30,493 | $21,769 |
Similar Demographics by Median Household Income
Demographics Similar to Immigrants from Sri Lanka by Median Household Income
In terms of median household income, the demographic groups most similar to Immigrants from Sri Lanka are Immigrants from Asia ($99,933, a difference of 0.010%), Immigrants from Northern Europe ($99,813, a difference of 0.13%), Bhutanese ($100,151, a difference of 0.21%), Immigrants from Belgium ($100,306, a difference of 0.36%), and Turkish ($99,389, a difference of 0.56%).
| Demographics | Rating | Rank | Median Household Income |
| Eastern Europeans | 100.0 /100 | #21 | Exceptional $101,781 |
| Asians | 100.0 /100 | #22 | Exceptional $101,681 |
| Immigrants | Bolivia | 100.0 /100 | #23 | Exceptional $101,394 |
| Immigrants | Japan | 100.0 /100 | #24 | Exceptional $100,711 |
| Immigrants | Sweden | 100.0 /100 | #25 | Exceptional $100,699 |
| Immigrants | Belgium | 100.0 /100 | #26 | Exceptional $100,306 |
| Bhutanese | 100.0 /100 | #27 | Exceptional $100,151 |
| Immigrants | Sri Lanka | 100.0 /100 | #28 | Exceptional $99,943 |
| Immigrants | Asia | 100.0 /100 | #29 | Exceptional $99,933 |
| Immigrants | Northern Europe | 100.0 /100 | #30 | Exceptional $99,813 |
| Turks | 100.0 /100 | #31 | Exceptional $99,389 |
| Immigrants | Denmark | 100.0 /100 | #32 | Exceptional $98,510 |
| Chinese | 100.0 /100 | #33 | Exceptional $98,496 |
| Russians | 100.0 /100 | #34 | Exceptional $98,008 |
| Immigrants | Switzerland | 100.0 /100 | #35 | Exceptional $97,979 |
Demographics Similar to Immigrants from Germany by Median Household Income
In terms of median household income, the demographic groups most similar to Immigrants from Germany are South American ($86,824, a difference of 0.070%), Immigrants from Saudi Arabia ($86,875, a difference of 0.13%), Carpatho Rusyn ($86,635, a difference of 0.15%), Hungarian ($86,920, a difference of 0.18%), and Basque ($87,001, a difference of 0.27%).
| Demographics | Rating | Rank | Median Household Income |
| South American Indians | 81.8 /100 | #147 | Excellent $87,446 |
| Costa Ricans | 80.0 /100 | #148 | Excellent $87,262 |
| Immigrants | Nepal | 77.7 /100 | #149 | Good $87,046 |
| Basques | 77.2 /100 | #150 | Good $87,001 |
| Hungarians | 76.3 /100 | #151 | Good $86,920 |
| Immigrants | Saudi Arabia | 75.8 /100 | #152 | Good $86,875 |
| South Americans | 75.1 /100 | #153 | Good $86,824 |
| Immigrants | Germany | 74.4 /100 | #154 | Good $86,764 |
| Carpatho Rusyns | 72.8 /100 | #155 | Good $86,635 |
| Immigrants | Albania | 71.5 /100 | #156 | Good $86,534 |
| Samoans | 71.0 /100 | #157 | Good $86,498 |
| Moroccans | 70.6 /100 | #158 | Good $86,468 |
| Immigrants | Uzbekistan | 70.1 /100 | #159 | Good $86,425 |
| Luxembourgers | 70.0 /100 | #160 | Good $86,418 |
| Slavs | 69.7 /100 | #161 | Good $86,398 |