Yakama vs Immigrants from Germany 12th Grade, No Diploma
COMPARE
Yakama
Immigrants from Germany
12th Grade, No Diploma
12th Grade, No Diploma Comparison
Yakama
Immigrants from Germany
82.5%
12TH GRADE, NO DIPLOMA
0.0/ 100
METRIC RATING
346th/ 347
METRIC RANK
92.0%
12TH GRADE, NO DIPLOMA
95.5/ 100
METRIC RATING
119th/ 347
METRIC RANK
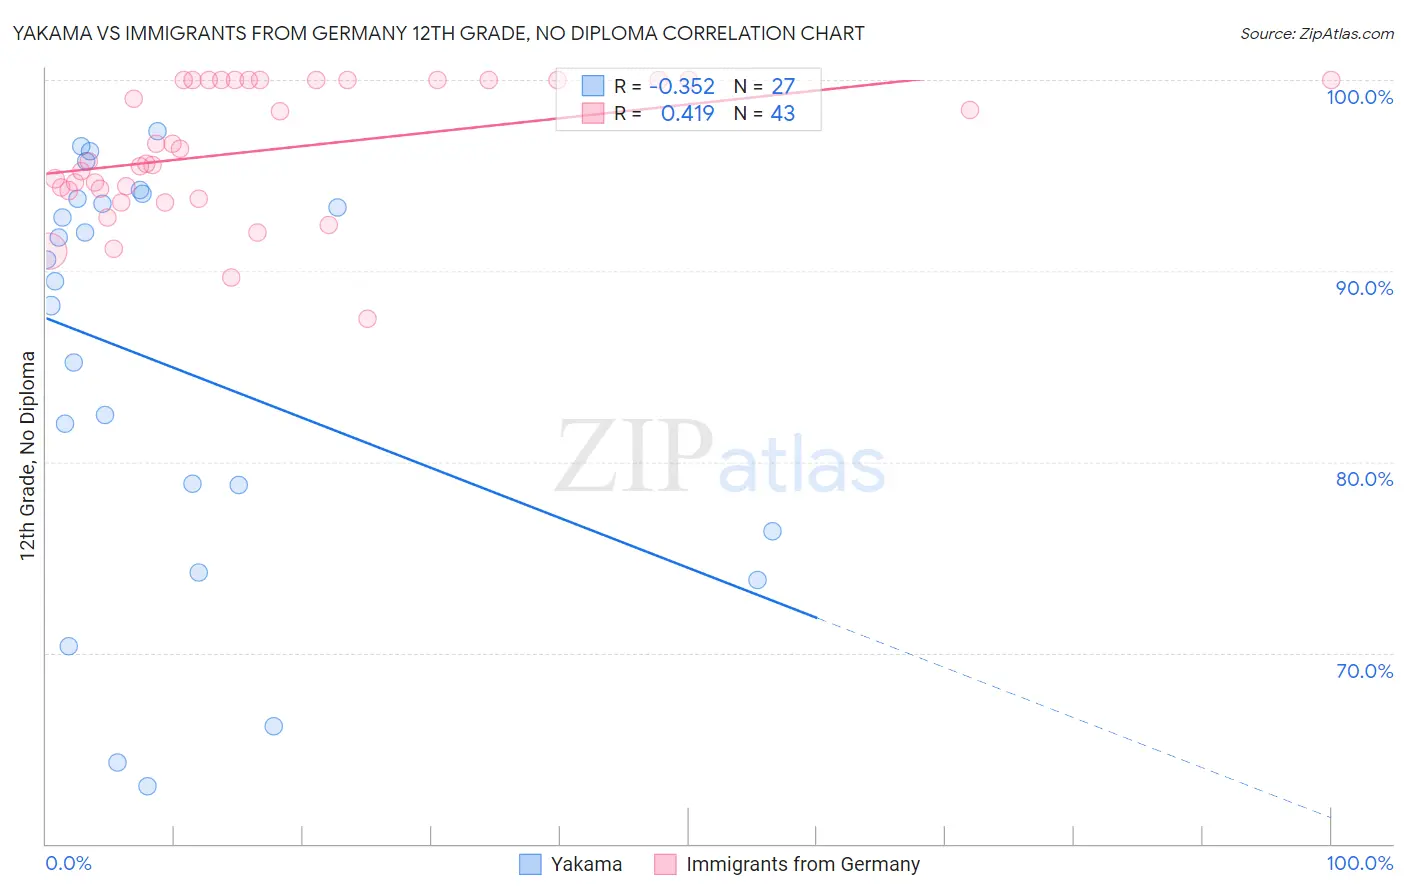
Yakama vs Immigrants from Germany 12th Grade, No Diploma Correlation Chart
The statistical analysis conducted on geographies consisting of 19,923,144 people shows a mild negative correlation between the proportion of Yakama and percentage of population with at least 12th grade (no diploma) education in the United States with a correlation coefficient (R) of -0.352 and weighted average of 82.5%. Similarly, the statistical analysis conducted on geographies consisting of 463,886,936 people shows a moderate positive correlation between the proportion of Immigrants from Germany and percentage of population with at least 12th grade (no diploma) education in the United States with a correlation coefficient (R) of 0.419 and weighted average of 92.0%, a difference of 11.6%.
12th Grade, No Diploma Correlation Summary
| Measurement | Yakama | Immigrants from Germany |
| Minimum | 63.0% | 87.5% |
| Maximum | 97.3% | 100.0% |
| Range | 34.3% | 12.5% |
| Mean | 85.0% | 96.3% |
| Median | 89.4% | 95.8% |
| Interquartile 25% (IQ1) | 76.4% | 94.2% |
| Interquartile 75% (IQ3) | 93.8% | 100.0% |
| Interquartile Range (IQR) | 17.4% | 5.8% |
| Standard Deviation (Sample) | 10.8% | 3.4% |
| Standard Deviation (Population) | 10.6% | 3.4% |
Similar Demographics by 12th Grade, No Diploma
Demographics Similar to Yakama by 12th Grade, No Diploma
In terms of 12th grade, no diploma, the demographic groups most similar to Yakama are Immigrants from Mexico (82.4%, a difference of 0.040%), Spanish American Indian (82.9%, a difference of 0.53%), Immigrants from Central America (83.0%, a difference of 0.60%), Immigrants from El Salvador (83.6%, a difference of 1.3%), and Houma (83.7%, a difference of 1.5%).
| Demographics | Rating | Rank | 12th Grade, No Diploma |
| Immigrants | Latin America | 0.0 /100 | #333 | Tragic 85.0% |
| Immigrants | Dominican Republic | 0.0 /100 | #334 | Tragic 84.9% |
| Immigrants | Yemen | 0.0 /100 | #335 | Tragic 84.8% |
| Tohono O'odham | 0.0 /100 | #336 | Tragic 84.7% |
| Pima | 0.0 /100 | #337 | Tragic 84.6% |
| Guatemalans | 0.0 /100 | #338 | Tragic 84.6% |
| Salvadorans | 0.0 /100 | #339 | Tragic 84.5% |
| Mexicans | 0.0 /100 | #340 | Tragic 84.1% |
| Immigrants | Guatemala | 0.0 /100 | #341 | Tragic 84.0% |
| Houma | 0.0 /100 | #342 | Tragic 83.7% |
| Immigrants | El Salvador | 0.0 /100 | #343 | Tragic 83.6% |
| Immigrants | Central America | 0.0 /100 | #344 | Tragic 83.0% |
| Spanish American Indians | 0.0 /100 | #345 | Tragic 82.9% |
| Yakama | 0.0 /100 | #346 | Tragic 82.5% |
| Immigrants | Mexico | 0.0 /100 | #347 | Tragic 82.4% |
Demographics Similar to Immigrants from Germany by 12th Grade, No Diploma
In terms of 12th grade, no diploma, the demographic groups most similar to Immigrants from Germany are Puget Sound Salish (92.0%, a difference of 0.030%), Immigrants from Eastern Europe (92.1%, a difference of 0.060%), Immigrants from Sri Lanka (92.1%, a difference of 0.070%), Aleut (92.1%, a difference of 0.070%), and Immigrants from Zimbabwe (92.1%, a difference of 0.080%).
| Demographics | Rating | Rank | 12th Grade, No Diploma |
| Israelis | 96.8 /100 | #112 | Exceptional 92.1% |
| Immigrants | Zimbabwe | 96.5 /100 | #113 | Exceptional 92.1% |
| Yugoslavians | 96.5 /100 | #114 | Exceptional 92.1% |
| Immigrants | Sri Lanka | 96.4 /100 | #115 | Exceptional 92.1% |
| Aleuts | 96.3 /100 | #116 | Exceptional 92.1% |
| Immigrants | Eastern Europe | 96.3 /100 | #117 | Exceptional 92.1% |
| Puget Sound Salish | 95.8 /100 | #118 | Exceptional 92.0% |
| Immigrants | Germany | 95.5 /100 | #119 | Exceptional 92.0% |
| Immigrants | Kazakhstan | 94.2 /100 | #120 | Exceptional 91.9% |
| Menominee | 93.5 /100 | #121 | Exceptional 91.9% |
| Ottawa | 93.1 /100 | #122 | Exceptional 91.9% |
| Egyptians | 92.5 /100 | #123 | Exceptional 91.9% |
| Immigrants | Ukraine | 91.6 /100 | #124 | Exceptional 91.8% |
| Whites/Caucasians | 91.6 /100 | #125 | Exceptional 91.8% |
| Basques | 91.3 /100 | #126 | Exceptional 91.8% |