Immigrants from Pakistan vs Eastern European Median Household Income
COMPARE
Immigrants from Pakistan
Eastern European
Median Household Income
Median Household Income Comparison
Immigrants from Pakistan
Eastern Europeans
$97,528
MEDIAN HOUSEHOLD INCOME
100.0/ 100
METRIC RATING
36th/ 347
METRIC RANK
$101,781
MEDIAN HOUSEHOLD INCOME
100.0/ 100
METRIC RATING
21st/ 347
METRIC RANK
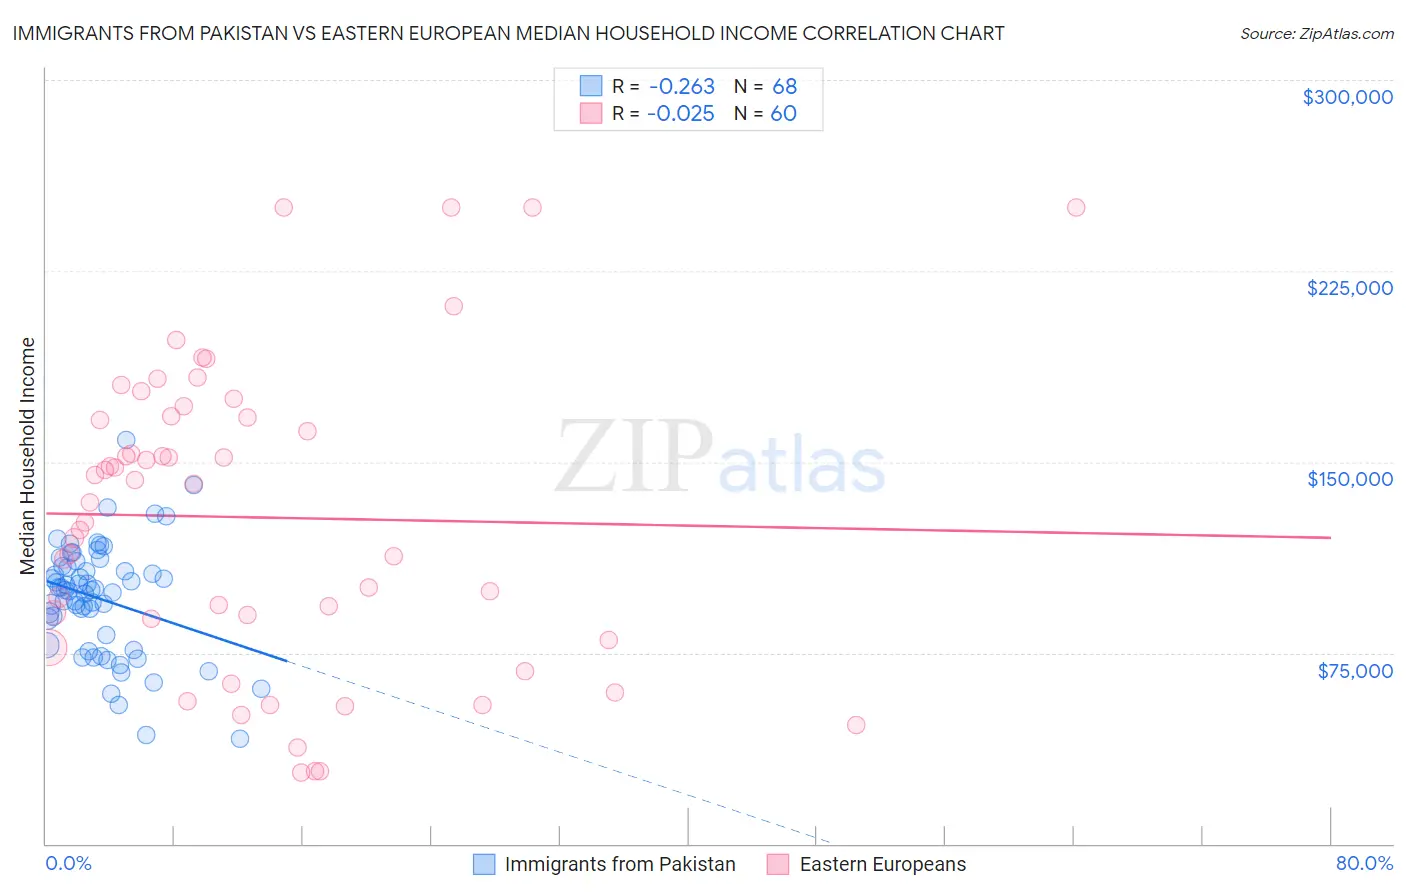
Immigrants from Pakistan vs Eastern European Median Household Income Correlation Chart
The statistical analysis conducted on geographies consisting of 283,734,459 people shows a weak negative correlation between the proportion of Immigrants from Pakistan and median household income in the United States with a correlation coefficient (R) of -0.263 and weighted average of $97,528. Similarly, the statistical analysis conducted on geographies consisting of 460,842,192 people shows no correlation between the proportion of Eastern Europeans and median household income in the United States with a correlation coefficient (R) of -0.025 and weighted average of $101,781, a difference of 4.4%.
Median Household Income Correlation Summary
| Measurement | Immigrants from Pakistan | Eastern European |
| Minimum | $41,375 | $28,140 |
| Maximum | $158,426 | $250,001 |
| Range | $117,051 | $221,861 |
| Mean | $96,211 | $128,179 |
| Median | $99,663 | $137,749 |
| Interquartile 25% (IQ1) | $79,936 | $84,285 |
| Interquartile 75% (IQ3) | $108,805 | $167,660 |
| Interquartile Range (IQR) | $28,869 | $83,375 |
| Standard Deviation (Sample) | $22,052 | $58,971 |
| Standard Deviation (Population) | $21,889 | $58,477 |
Demographics Similar to Immigrants from Pakistan and Eastern Europeans by Median Household Income
In terms of median household income, the demographic groups most similar to Immigrants from Pakistan are Latvian ($97,311, a difference of 0.22%), Immigrants from Indonesia ($97,297, a difference of 0.24%), Immigrants from Switzerland ($97,979, a difference of 0.46%), Russian ($98,008, a difference of 0.49%), and Chinese ($98,496, a difference of 0.99%). Similarly, the demographic groups most similar to Eastern Europeans are Asian ($101,681, a difference of 0.10%), Immigrants from Bolivia ($101,394, a difference of 0.38%), Bolivian ($102,195, a difference of 0.41%), Immigrants from Australia ($102,562, a difference of 0.77%), and Cypriot ($102,843, a difference of 1.0%).
| Demographics | Rating | Rank | Median Household Income |
| Cypriots | 100.0 /100 | #18 | Exceptional $102,843 |
| Immigrants | Australia | 100.0 /100 | #19 | Exceptional $102,562 |
| Bolivians | 100.0 /100 | #20 | Exceptional $102,195 |
| Eastern Europeans | 100.0 /100 | #21 | Exceptional $101,781 |
| Asians | 100.0 /100 | #22 | Exceptional $101,681 |
| Immigrants | Bolivia | 100.0 /100 | #23 | Exceptional $101,394 |
| Immigrants | Japan | 100.0 /100 | #24 | Exceptional $100,711 |
| Immigrants | Sweden | 100.0 /100 | #25 | Exceptional $100,699 |
| Immigrants | Belgium | 100.0 /100 | #26 | Exceptional $100,306 |
| Bhutanese | 100.0 /100 | #27 | Exceptional $100,151 |
| Immigrants | Sri Lanka | 100.0 /100 | #28 | Exceptional $99,943 |
| Immigrants | Asia | 100.0 /100 | #29 | Exceptional $99,933 |
| Immigrants | Northern Europe | 100.0 /100 | #30 | Exceptional $99,813 |
| Turks | 100.0 /100 | #31 | Exceptional $99,389 |
| Immigrants | Denmark | 100.0 /100 | #32 | Exceptional $98,510 |
| Chinese | 100.0 /100 | #33 | Exceptional $98,496 |
| Russians | 100.0 /100 | #34 | Exceptional $98,008 |
| Immigrants | Switzerland | 100.0 /100 | #35 | Exceptional $97,979 |
| Immigrants | Pakistan | 100.0 /100 | #36 | Exceptional $97,528 |
| Latvians | 100.0 /100 | #37 | Exceptional $97,311 |
| Immigrants | Indonesia | 100.0 /100 | #38 | Exceptional $97,297 |