Cuban vs Eastern European Median Household Income
COMPARE
Cuban
Eastern European
Median Household Income
Median Household Income Comparison
Cubans
Eastern Europeans
$73,392
MEDIAN HOUSEHOLD INCOME
0.1/ 100
METRIC RATING
295th/ 347
METRIC RANK
$101,781
MEDIAN HOUSEHOLD INCOME
100.0/ 100
METRIC RATING
21st/ 347
METRIC RANK
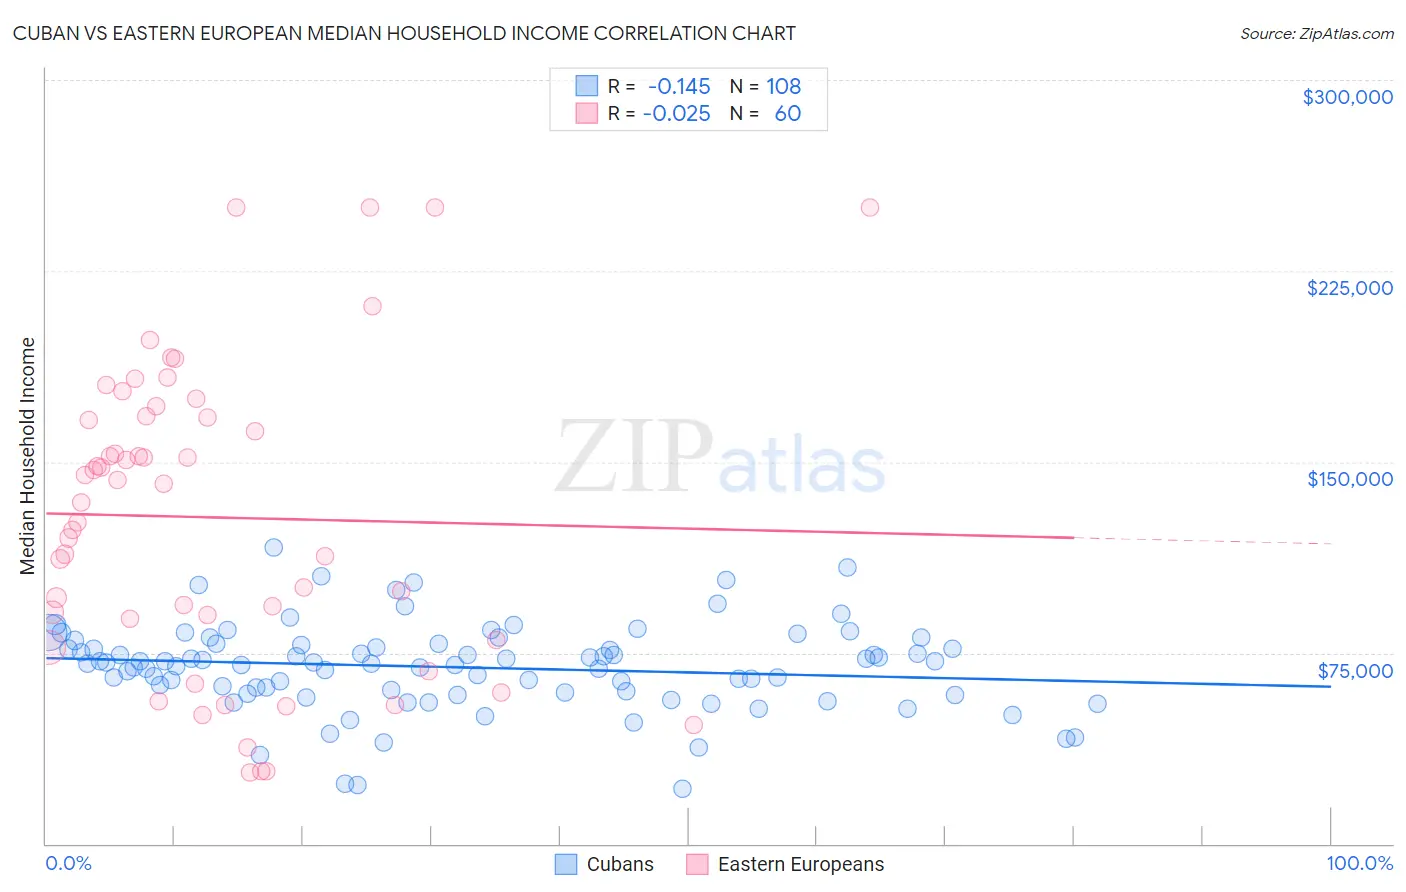
Cuban vs Eastern European Median Household Income Correlation Chart
The statistical analysis conducted on geographies consisting of 448,852,866 people shows a poor negative correlation between the proportion of Cubans and median household income in the United States with a correlation coefficient (R) of -0.145 and weighted average of $73,392. Similarly, the statistical analysis conducted on geographies consisting of 460,842,192 people shows no correlation between the proportion of Eastern Europeans and median household income in the United States with a correlation coefficient (R) of -0.025 and weighted average of $101,781, a difference of 38.7%.
Median Household Income Correlation Summary
| Measurement | Cuban | Eastern European |
| Minimum | $21,567 | $28,140 |
| Maximum | $116,431 | $250,001 |
| Range | $94,864 | $221,861 |
| Mean | $69,339 | $128,179 |
| Median | $70,955 | $137,749 |
| Interquartile 25% (IQ1) | $59,587 | $84,285 |
| Interquartile 75% (IQ3) | $78,118 | $167,660 |
| Interquartile Range (IQR) | $18,531 | $83,375 |
| Standard Deviation (Sample) | $17,087 | $58,971 |
| Standard Deviation (Population) | $17,007 | $58,477 |
Similar Demographics by Median Household Income
Demographics Similar to Cubans by Median Household Income
In terms of median household income, the demographic groups most similar to Cubans are Haitian ($73,306, a difference of 0.12%), Blackfeet ($73,509, a difference of 0.16%), Immigrants from Cabo Verde ($73,515, a difference of 0.17%), Immigrants from Mexico ($73,160, a difference of 0.32%), and Comanche ($73,747, a difference of 0.48%).
| Demographics | Rating | Rank | Median Household Income |
| Immigrants | Central America | 0.1 /100 | #288 | Tragic $74,217 |
| Fijians | 0.1 /100 | #289 | Tragic $74,205 |
| Bangladeshis | 0.1 /100 | #290 | Tragic $74,112 |
| Hispanics or Latinos | 0.1 /100 | #291 | Tragic $73,823 |
| Comanche | 0.1 /100 | #292 | Tragic $73,747 |
| Immigrants | Cabo Verde | 0.1 /100 | #293 | Tragic $73,515 |
| Blackfeet | 0.1 /100 | #294 | Tragic $73,509 |
| Cubans | 0.1 /100 | #295 | Tragic $73,392 |
| Haitians | 0.1 /100 | #296 | Tragic $73,306 |
| Immigrants | Mexico | 0.0 /100 | #297 | Tragic $73,160 |
| Paiute | 0.0 /100 | #298 | Tragic $72,959 |
| Indonesians | 0.0 /100 | #299 | Tragic $72,856 |
| Immigrants | Dominica | 0.0 /100 | #300 | Tragic $72,760 |
| Cherokee | 0.0 /100 | #301 | Tragic $72,682 |
| Shoshone | 0.0 /100 | #302 | Tragic $72,660 |
Demographics Similar to Eastern Europeans by Median Household Income
In terms of median household income, the demographic groups most similar to Eastern Europeans are Asian ($101,681, a difference of 0.10%), Immigrants from Bolivia ($101,394, a difference of 0.38%), Bolivian ($102,195, a difference of 0.41%), Immigrants from Australia ($102,562, a difference of 0.77%), and Cypriot ($102,843, a difference of 1.0%).
| Demographics | Rating | Rank | Median Household Income |
| Immigrants | Ireland | 100.0 /100 | #14 | Exceptional $104,692 |
| Immigrants | Israel | 100.0 /100 | #15 | Exceptional $104,090 |
| Burmese | 100.0 /100 | #16 | Exceptional $103,145 |
| Immigrants | Korea | 100.0 /100 | #17 | Exceptional $102,962 |
| Cypriots | 100.0 /100 | #18 | Exceptional $102,843 |
| Immigrants | Australia | 100.0 /100 | #19 | Exceptional $102,562 |
| Bolivians | 100.0 /100 | #20 | Exceptional $102,195 |
| Eastern Europeans | 100.0 /100 | #21 | Exceptional $101,781 |
| Asians | 100.0 /100 | #22 | Exceptional $101,681 |
| Immigrants | Bolivia | 100.0 /100 | #23 | Exceptional $101,394 |
| Immigrants | Japan | 100.0 /100 | #24 | Exceptional $100,711 |
| Immigrants | Sweden | 100.0 /100 | #25 | Exceptional $100,699 |
| Immigrants | Belgium | 100.0 /100 | #26 | Exceptional $100,306 |
| Bhutanese | 100.0 /100 | #27 | Exceptional $100,151 |
| Immigrants | Sri Lanka | 100.0 /100 | #28 | Exceptional $99,943 |