White/Caucasian vs Immigrants from Bosnia and Herzegovina Median Household Income
COMPARE
White/Caucasian
Immigrants from Bosnia and Herzegovina
Median Household Income
Median Household Income Comparison
Whites/Caucasians
Immigrants from Bosnia and Herzegovina
$82,029
MEDIAN HOUSEHOLD INCOME
12.2/ 100
METRIC RATING
218th/ 347
METRIC RANK
$79,888
MEDIAN HOUSEHOLD INCOME
3.4/ 100
METRIC RATING
236th/ 347
METRIC RANK
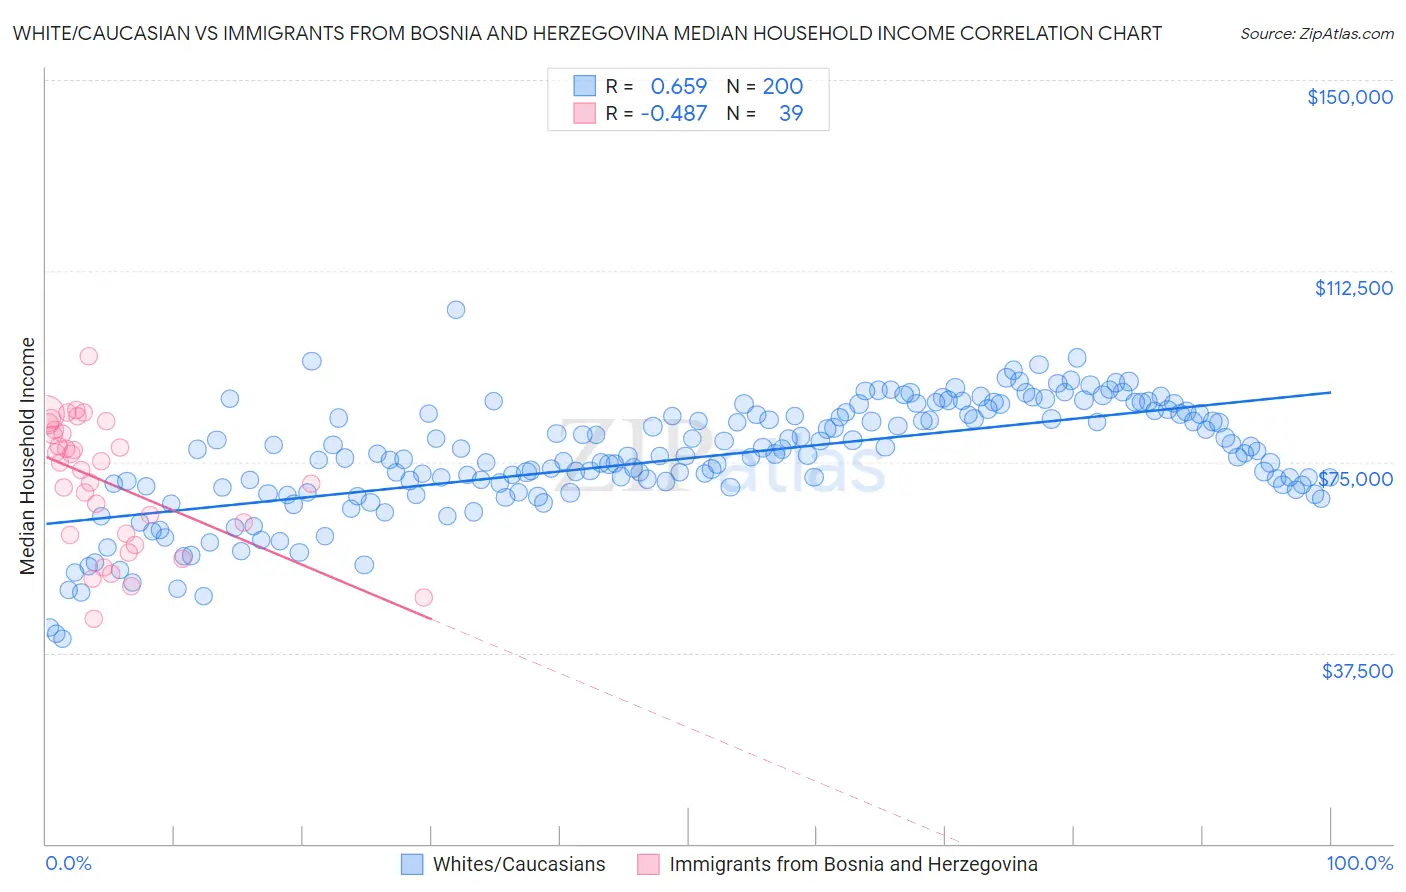
White/Caucasian vs Immigrants from Bosnia and Herzegovina Median Household Income Correlation Chart
The statistical analysis conducted on geographies consisting of 583,274,044 people shows a significant positive correlation between the proportion of Whites/Caucasians and median household income in the United States with a correlation coefficient (R) of 0.659 and weighted average of $82,029. Similarly, the statistical analysis conducted on geographies consisting of 156,785,228 people shows a moderate negative correlation between the proportion of Immigrants from Bosnia and Herzegovina and median household income in the United States with a correlation coefficient (R) of -0.487 and weighted average of $79,888, a difference of 2.7%.
Median Household Income Correlation Summary
| Measurement | White/Caucasian | Immigrants from Bosnia and Herzegovina |
| Minimum | $40,196 | $44,295 |
| Maximum | $104,886 | $95,813 |
| Range | $64,690 | $51,518 |
| Mean | $75,721 | $71,018 |
| Median | $76,251 | $74,982 |
| Interquartile 25% (IQ1) | $70,055 | $60,735 |
| Interquartile 75% (IQ3) | $84,369 | $81,375 |
| Interquartile Range (IQR) | $14,314 | $20,640 |
| Standard Deviation (Sample) | $11,326 | $12,624 |
| Standard Deviation (Population) | $11,297 | $12,461 |
Demographics Similar to Whites/Caucasians and Immigrants from Bosnia and Herzegovina by Median Household Income
In terms of median household income, the demographic groups most similar to Whites/Caucasians are Ecuadorian ($82,070, a difference of 0.050%), Nigerian ($81,725, a difference of 0.37%), Immigrants from Venezuela ($81,506, a difference of 0.64%), Immigrants from Ghana ($81,489, a difference of 0.66%), and Immigrants from Nigeria ($81,236, a difference of 0.98%). Similarly, the demographic groups most similar to Immigrants from Bosnia and Herzegovina are Nicaraguan ($79,737, a difference of 0.19%), Immigrants from Guyana ($80,324, a difference of 0.55%), Immigrants from Ecuador ($80,341, a difference of 0.57%), Immigrants from the Azores ($80,357, a difference of 0.59%), and Immigrants from Trinidad and Tobago ($80,373, a difference of 0.61%).
| Demographics | Rating | Rank | Median Household Income |
| Ecuadorians | 12.5 /100 | #217 | Poor $82,070 |
| Whites/Caucasians | 12.2 /100 | #218 | Poor $82,029 |
| Nigerians | 10.3 /100 | #219 | Poor $81,725 |
| Immigrants | Venezuela | 9.0 /100 | #220 | Tragic $81,506 |
| Immigrants | Ghana | 9.0 /100 | #221 | Tragic $81,489 |
| Immigrants | Nigeria | 7.7 /100 | #222 | Tragic $81,236 |
| Immigrants | El Salvador | 7.6 /100 | #223 | Tragic $81,213 |
| Malaysians | 7.0 /100 | #224 | Tragic $81,064 |
| Scotch-Irish | 6.6 /100 | #225 | Tragic $80,972 |
| Immigrants | Panama | 6.2 /100 | #226 | Tragic $80,873 |
| Guyanese | 5.7 /100 | #227 | Tragic $80,734 |
| Immigrants | Bangladesh | 5.7 /100 | #228 | Tragic $80,722 |
| Delaware | 5.0 /100 | #229 | Tragic $80,527 |
| Bermudans | 4.7 /100 | #230 | Tragic $80,406 |
| Trinidadians and Tobagonians | 4.7 /100 | #231 | Tragic $80,402 |
| Immigrants | Trinidad and Tobago | 4.6 /100 | #232 | Tragic $80,373 |
| Immigrants | Azores | 4.5 /100 | #233 | Tragic $80,357 |
| Immigrants | Ecuador | 4.5 /100 | #234 | Tragic $80,341 |
| Immigrants | Guyana | 4.5 /100 | #235 | Tragic $80,324 |
| Immigrants | Bosnia and Herzegovina | 3.4 /100 | #236 | Tragic $79,888 |
| Nicaraguans | 3.1 /100 | #237 | Tragic $79,737 |