White/Caucasian vs Immigrants from Somalia Median Household Income
COMPARE
White/Caucasian
Immigrants from Somalia
Median Household Income
Median Household Income Comparison
Whites/Caucasians
Immigrants from Somalia
$82,029
MEDIAN HOUSEHOLD INCOME
12.2/ 100
METRIC RATING
218th/ 347
METRIC RANK
$74,300
MEDIAN HOUSEHOLD INCOME
0.1/ 100
METRIC RATING
286th/ 347
METRIC RANK
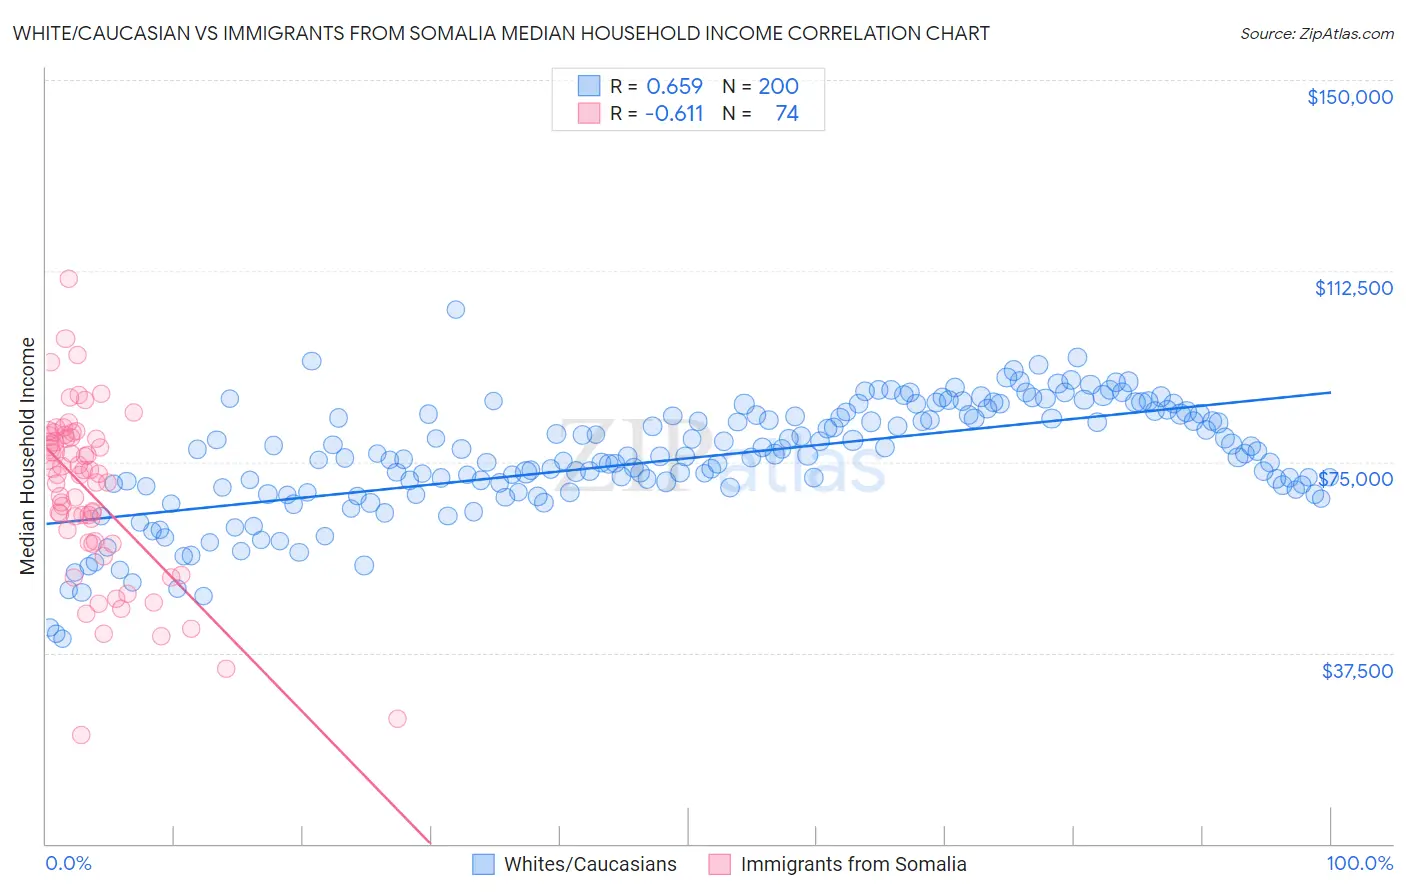
White/Caucasian vs Immigrants from Somalia Median Household Income Correlation Chart
The statistical analysis conducted on geographies consisting of 583,274,044 people shows a significant positive correlation between the proportion of Whites/Caucasians and median household income in the United States with a correlation coefficient (R) of 0.659 and weighted average of $82,029. Similarly, the statistical analysis conducted on geographies consisting of 92,093,487 people shows a significant negative correlation between the proportion of Immigrants from Somalia and median household income in the United States with a correlation coefficient (R) of -0.611 and weighted average of $74,300, a difference of 10.4%.
Median Household Income Correlation Summary
| Measurement | White/Caucasian | Immigrants from Somalia |
| Minimum | $40,196 | $21,288 |
| Maximum | $104,886 | $111,048 |
| Range | $64,690 | $89,760 |
| Mean | $75,721 | $68,739 |
| Median | $76,251 | $72,392 |
| Interquartile 25% (IQ1) | $70,055 | $59,132 |
| Interquartile 75% (IQ3) | $84,369 | $79,747 |
| Interquartile Range (IQR) | $14,314 | $20,615 |
| Standard Deviation (Sample) | $11,326 | $16,683 |
| Standard Deviation (Population) | $11,297 | $16,570 |
Similar Demographics by Median Household Income
Demographics Similar to Whites/Caucasians by Median Household Income
In terms of median household income, the demographic groups most similar to Whites/Caucasians are Ecuadorian ($82,070, a difference of 0.050%), Yugoslavian ($82,186, a difference of 0.19%), Vietnamese ($82,248, a difference of 0.27%), Panamanian ($82,272, a difference of 0.30%), and Nigerian ($81,725, a difference of 0.37%).
| Demographics | Rating | Rank | Median Household Income |
| Salvadorans | 15.4 /100 | #211 | Poor $82,449 |
| Venezuelans | 15.3 /100 | #212 | Poor $82,432 |
| Nepalese | 15.1 /100 | #213 | Poor $82,410 |
| Panamanians | 14.0 /100 | #214 | Poor $82,272 |
| Vietnamese | 13.8 /100 | #215 | Poor $82,248 |
| Yugoslavians | 13.3 /100 | #216 | Poor $82,186 |
| Ecuadorians | 12.5 /100 | #217 | Poor $82,070 |
| Whites/Caucasians | 12.2 /100 | #218 | Poor $82,029 |
| Nigerians | 10.3 /100 | #219 | Poor $81,725 |
| Immigrants | Venezuela | 9.0 /100 | #220 | Tragic $81,506 |
| Immigrants | Ghana | 9.0 /100 | #221 | Tragic $81,489 |
| Immigrants | Nigeria | 7.7 /100 | #222 | Tragic $81,236 |
| Immigrants | El Salvador | 7.6 /100 | #223 | Tragic $81,213 |
| Malaysians | 7.0 /100 | #224 | Tragic $81,064 |
| Scotch-Irish | 6.6 /100 | #225 | Tragic $80,972 |
Demographics Similar to Immigrants from Somalia by Median Household Income
In terms of median household income, the demographic groups most similar to Immigrants from Somalia are Iroquois ($74,279, a difference of 0.030%), Immigrants from Central America ($74,217, a difference of 0.11%), Mexican ($74,399, a difference of 0.13%), Fijian ($74,205, a difference of 0.13%), and Bangladeshi ($74,112, a difference of 0.25%).
| Demographics | Rating | Rank | Median Household Income |
| Immigrants | Guatemala | 0.2 /100 | #279 | Tragic $75,123 |
| Senegalese | 0.2 /100 | #280 | Tragic $74,999 |
| Immigrants | Liberia | 0.1 /100 | #281 | Tragic $74,896 |
| Central American Indians | 0.1 /100 | #282 | Tragic $74,847 |
| Cree | 0.1 /100 | #283 | Tragic $74,685 |
| Yaqui | 0.1 /100 | #284 | Tragic $74,596 |
| Mexicans | 0.1 /100 | #285 | Tragic $74,399 |
| Immigrants | Somalia | 0.1 /100 | #286 | Tragic $74,300 |
| Iroquois | 0.1 /100 | #287 | Tragic $74,279 |
| Immigrants | Central America | 0.1 /100 | #288 | Tragic $74,217 |
| Fijians | 0.1 /100 | #289 | Tragic $74,205 |
| Bangladeshis | 0.1 /100 | #290 | Tragic $74,112 |
| Hispanics or Latinos | 0.1 /100 | #291 | Tragic $73,823 |
| Comanche | 0.1 /100 | #292 | Tragic $73,747 |
| Immigrants | Cabo Verde | 0.1 /100 | #293 | Tragic $73,515 |