Immigrants from Chile vs Delaware Per Capita Income
COMPARE
Immigrants from Chile
Delaware
Per Capita Income
Per Capita Income Comparison
Immigrants from Chile
Delaware
$46,213
PER CAPITA INCOME
94.6/ 100
METRIC RATING
115th/ 347
METRIC RANK
$40,778
PER CAPITA INCOME
3.8/ 100
METRIC RATING
233rd/ 347
METRIC RANK
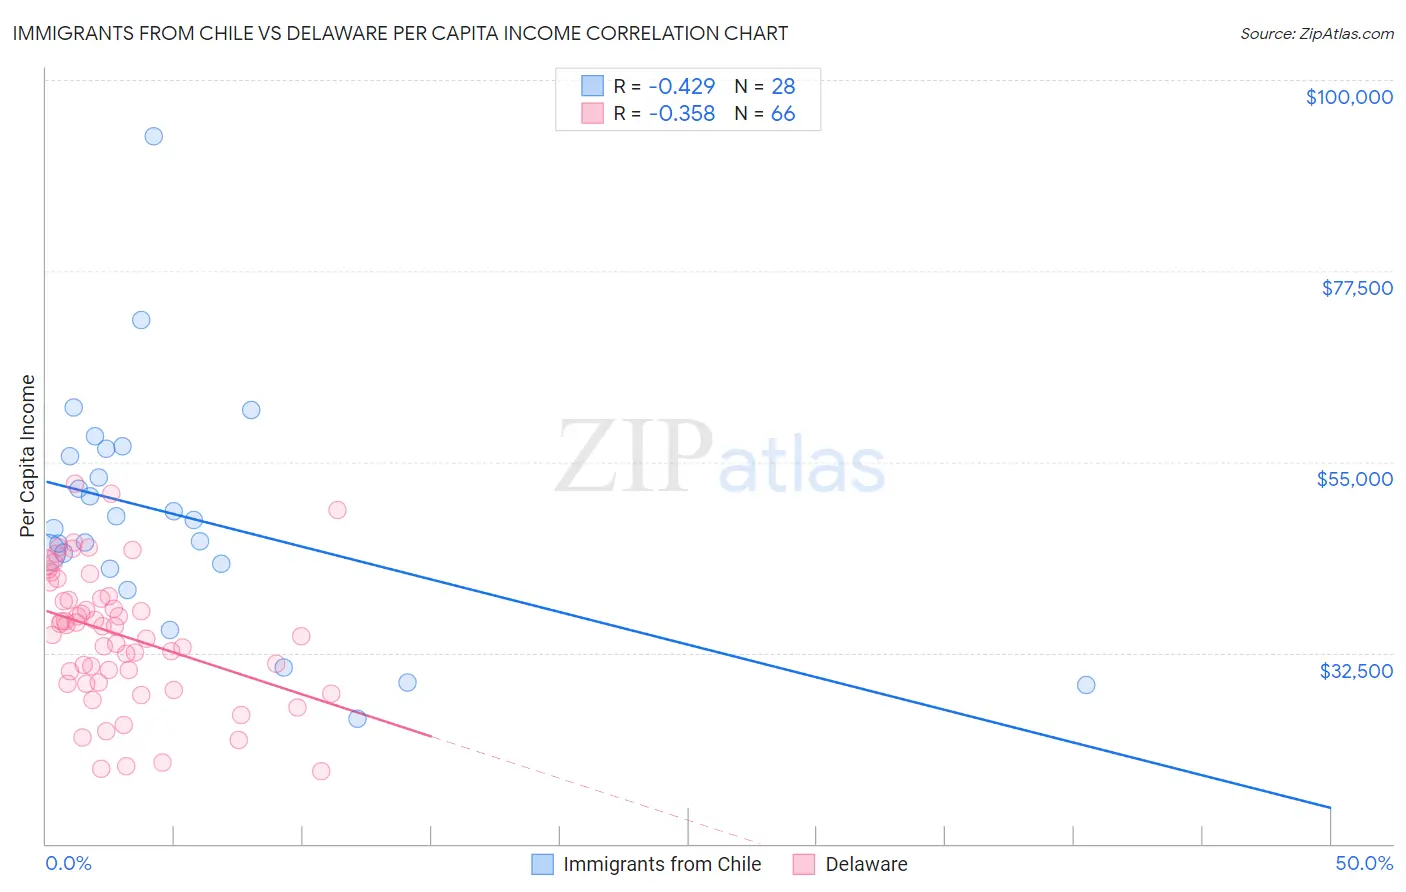
Immigrants from Chile vs Delaware Per Capita Income Correlation Chart
The statistical analysis conducted on geographies consisting of 218,646,729 people shows a moderate negative correlation between the proportion of Immigrants from Chile and per capita income in the United States with a correlation coefficient (R) of -0.429 and weighted average of $46,213. Similarly, the statistical analysis conducted on geographies consisting of 96,239,490 people shows a mild negative correlation between the proportion of Delaware and per capita income in the United States with a correlation coefficient (R) of -0.358 and weighted average of $40,778, a difference of 13.3%.
Per Capita Income Correlation Summary
| Measurement | Immigrants from Chile | Delaware |
| Minimum | $24,660 | $18,507 |
| Maximum | $93,304 | $52,470 |
| Range | $68,644 | $33,963 |
| Mean | $48,666 | $34,628 |
| Median | $47,656 | $35,673 |
| Interquartile 25% (IQ1) | $42,721 | $29,044 |
| Interquartile 75% (IQ3) | $56,086 | $39,167 |
| Interquartile Range (IQR) | $13,365 | $10,124 |
| Standard Deviation (Sample) | $13,904 | $7,889 |
| Standard Deviation (Population) | $13,654 | $7,829 |
Similar Demographics by Per Capita Income
Demographics Similar to Immigrants from Chile by Per Capita Income
In terms of per capita income, the demographic groups most similar to Immigrants from Chile are Afghan ($46,268, a difference of 0.12%), Polish ($46,123, a difference of 0.20%), Chinese ($46,098, a difference of 0.25%), Immigrants from Albania ($46,387, a difference of 0.38%), and Immigrants from Saudi Arabia ($46,008, a difference of 0.45%).
| Demographics | Rating | Rank | Per Capita Income |
| Immigrants | Kuwait | 96.2 /100 | #108 | Exceptional $46,543 |
| Immigrants | Northern Africa | 96.2 /100 | #109 | Exceptional $46,531 |
| Chileans | 95.9 /100 | #110 | Exceptional $46,459 |
| Taiwanese | 95.8 /100 | #111 | Exceptional $46,455 |
| Immigrants | Morocco | 95.7 /100 | #112 | Exceptional $46,430 |
| Immigrants | Albania | 95.5 /100 | #113 | Exceptional $46,387 |
| Afghans | 94.9 /100 | #114 | Exceptional $46,268 |
| Immigrants | Chile | 94.6 /100 | #115 | Exceptional $46,213 |
| Poles | 94.1 /100 | #116 | Exceptional $46,123 |
| Chinese | 93.9 /100 | #117 | Exceptional $46,098 |
| Immigrants | Saudi Arabia | 93.3 /100 | #118 | Exceptional $46,008 |
| Immigrants | Poland | 93.1 /100 | #119 | Exceptional $45,979 |
| Immigrants | Ethiopia | 92.7 /100 | #120 | Exceptional $45,923 |
| Canadians | 92.2 /100 | #121 | Exceptional $45,858 |
| Moroccans | 92.1 /100 | #122 | Exceptional $45,854 |
Demographics Similar to Delaware by Per Capita Income
In terms of per capita income, the demographic groups most similar to Delaware are Immigrants from West Indies ($40,763, a difference of 0.040%), Immigrants from Guyana ($40,742, a difference of 0.090%), Nonimmigrants ($40,669, a difference of 0.27%), Guyanese ($40,949, a difference of 0.42%), and Senegalese ($41,000, a difference of 0.55%).
| Demographics | Rating | Rank | Per Capita Income |
| Immigrants | Ecuador | 5.9 /100 | #226 | Tragic $41,195 |
| Immigrants | Ghana | 5.5 /100 | #227 | Tragic $41,131 |
| Immigrants | Grenada | 5.5 /100 | #228 | Tragic $41,123 |
| Nigerians | 4.9 /100 | #229 | Tragic $41,026 |
| Native Hawaiians | 4.9 /100 | #230 | Tragic $41,017 |
| Senegalese | 4.8 /100 | #231 | Tragic $41,000 |
| Guyanese | 4.5 /100 | #232 | Tragic $40,949 |
| Delaware | 3.8 /100 | #233 | Tragic $40,778 |
| Immigrants | West Indies | 3.7 /100 | #234 | Tragic $40,763 |
| Immigrants | Guyana | 3.6 /100 | #235 | Tragic $40,742 |
| Immigrants | Nonimmigrants | 3.4 /100 | #236 | Tragic $40,669 |
| Immigrants | Cambodia | 2.6 /100 | #237 | Tragic $40,434 |
| Somalis | 2.4 /100 | #238 | Tragic $40,367 |
| Tsimshian | 2.4 /100 | #239 | Tragic $40,344 |
| Immigrants | Nigeria | 2.3 /100 | #240 | Tragic $40,339 |