Immigrants from Netherlands vs Delaware Per Capita Income
COMPARE
Immigrants from Netherlands
Delaware
Per Capita Income
Per Capita Income Comparison
Immigrants from Netherlands
Delaware
$50,458
PER CAPITA INCOME
100.0/ 100
METRIC RATING
51st/ 347
METRIC RANK
$40,778
PER CAPITA INCOME
3.8/ 100
METRIC RATING
233rd/ 347
METRIC RANK
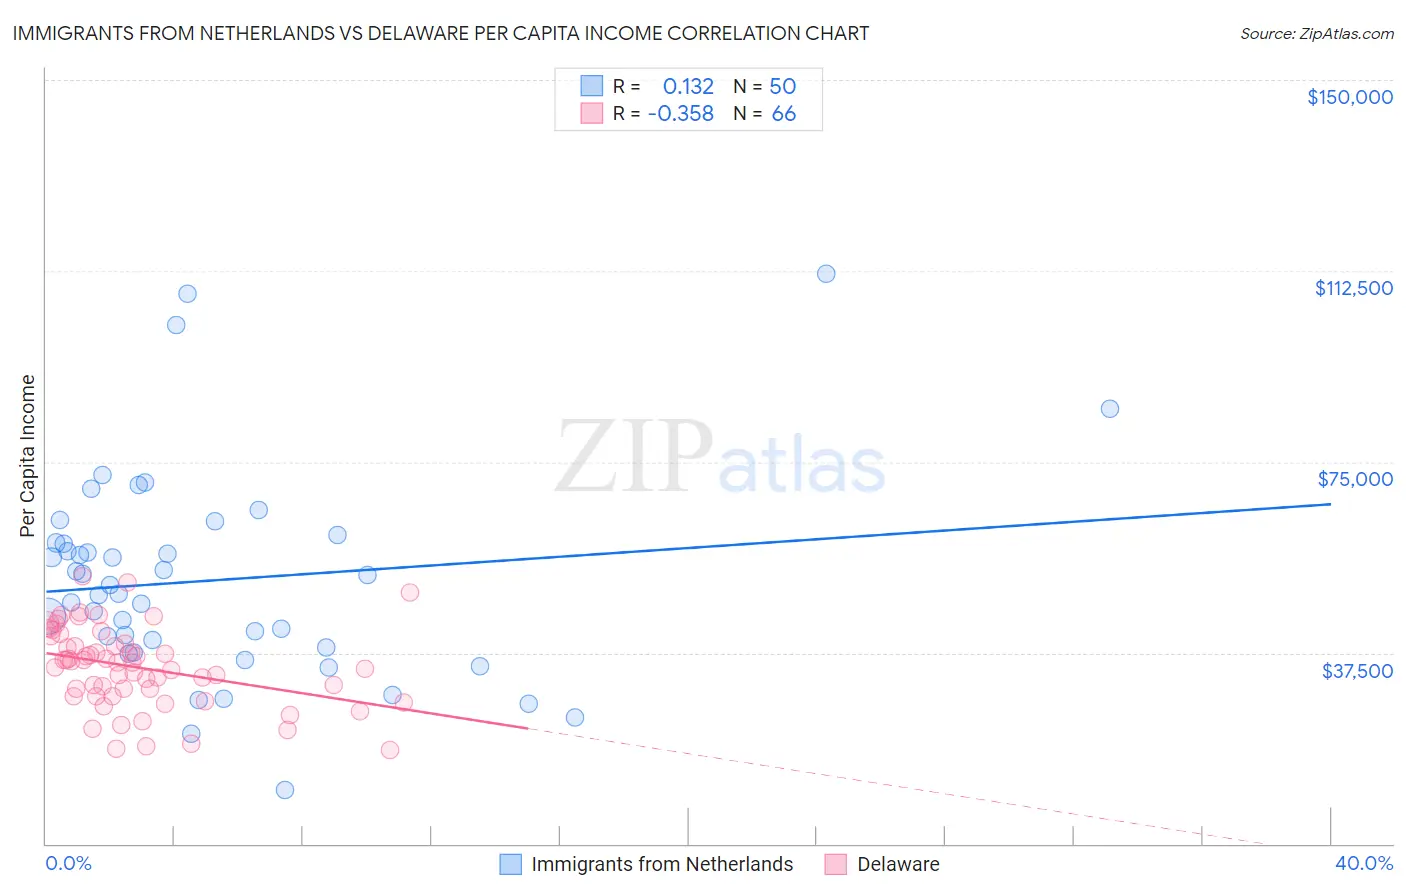
Immigrants from Netherlands vs Delaware Per Capita Income Correlation Chart
The statistical analysis conducted on geographies consisting of 237,881,407 people shows a poor positive correlation between the proportion of Immigrants from Netherlands and per capita income in the United States with a correlation coefficient (R) of 0.132 and weighted average of $50,458. Similarly, the statistical analysis conducted on geographies consisting of 96,239,490 people shows a mild negative correlation between the proportion of Delaware and per capita income in the United States with a correlation coefficient (R) of -0.358 and weighted average of $40,778, a difference of 23.7%.
Per Capita Income Correlation Summary
| Measurement | Immigrants from Netherlands | Delaware |
| Minimum | $10,464 | $18,507 |
| Maximum | $111,976 | $52,470 |
| Range | $101,512 | $33,963 |
| Mean | $51,773 | $34,628 |
| Median | $49,974 | $35,673 |
| Interquartile 25% (IQ1) | $38,654 | $29,044 |
| Interquartile 75% (IQ3) | $59,110 | $39,167 |
| Interquartile Range (IQR) | $20,456 | $10,124 |
| Standard Deviation (Sample) | $20,417 | $7,889 |
| Standard Deviation (Population) | $20,212 | $7,829 |
Similar Demographics by Per Capita Income
Demographics Similar to Immigrants from Netherlands by Per Capita Income
In terms of per capita income, the demographic groups most similar to Immigrants from Netherlands are Immigrants from Croatia ($50,417, a difference of 0.080%), Paraguayan ($50,385, a difference of 0.14%), Immigrants from Sri Lanka ($50,555, a difference of 0.19%), New Zealander ($50,575, a difference of 0.23%), and Immigrants from Belarus ($50,303, a difference of 0.31%).
| Demographics | Rating | Rank | Per Capita Income |
| Immigrants | Europe | 100.0 /100 | #44 | Exceptional $50,950 |
| Immigrants | Spain | 100.0 /100 | #45 | Exceptional $50,933 |
| Immigrants | Latvia | 100.0 /100 | #46 | Exceptional $50,914 |
| Bulgarians | 100.0 /100 | #47 | Exceptional $50,906 |
| Immigrants | Serbia | 100.0 /100 | #48 | Exceptional $50,810 |
| New Zealanders | 100.0 /100 | #49 | Exceptional $50,575 |
| Immigrants | Sri Lanka | 100.0 /100 | #50 | Exceptional $50,555 |
| Immigrants | Netherlands | 100.0 /100 | #51 | Exceptional $50,458 |
| Immigrants | Croatia | 99.9 /100 | #52 | Exceptional $50,417 |
| Paraguayans | 99.9 /100 | #53 | Exceptional $50,385 |
| Immigrants | Belarus | 99.9 /100 | #54 | Exceptional $50,303 |
| Immigrants | Western Europe | 99.9 /100 | #55 | Exceptional $50,065 |
| Asians | 99.9 /100 | #56 | Exceptional $50,057 |
| South Africans | 99.9 /100 | #57 | Exceptional $50,044 |
| Immigrants | Malaysia | 99.9 /100 | #58 | Exceptional $49,983 |
Demographics Similar to Delaware by Per Capita Income
In terms of per capita income, the demographic groups most similar to Delaware are Immigrants from West Indies ($40,763, a difference of 0.040%), Immigrants from Guyana ($40,742, a difference of 0.090%), Nonimmigrants ($40,669, a difference of 0.27%), Guyanese ($40,949, a difference of 0.42%), and Senegalese ($41,000, a difference of 0.55%).
| Demographics | Rating | Rank | Per Capita Income |
| Immigrants | Ecuador | 5.9 /100 | #226 | Tragic $41,195 |
| Immigrants | Ghana | 5.5 /100 | #227 | Tragic $41,131 |
| Immigrants | Grenada | 5.5 /100 | #228 | Tragic $41,123 |
| Nigerians | 4.9 /100 | #229 | Tragic $41,026 |
| Native Hawaiians | 4.9 /100 | #230 | Tragic $41,017 |
| Senegalese | 4.8 /100 | #231 | Tragic $41,000 |
| Guyanese | 4.5 /100 | #232 | Tragic $40,949 |
| Delaware | 3.8 /100 | #233 | Tragic $40,778 |
| Immigrants | West Indies | 3.7 /100 | #234 | Tragic $40,763 |
| Immigrants | Guyana | 3.6 /100 | #235 | Tragic $40,742 |
| Immigrants | Nonimmigrants | 3.4 /100 | #236 | Tragic $40,669 |
| Immigrants | Cambodia | 2.6 /100 | #237 | Tragic $40,434 |
| Somalis | 2.4 /100 | #238 | Tragic $40,367 |
| Tsimshian | 2.4 /100 | #239 | Tragic $40,344 |
| Immigrants | Nigeria | 2.3 /100 | #240 | Tragic $40,339 |