White/Caucasian vs Alaskan Athabascan Householder Income Ages 25 - 44 years
COMPARE
White/Caucasian
Alaskan Athabascan
Householder Income Ages 25 - 44 years
Householder Income Ages 25 - 44 years Comparison
Whites/Caucasians
Alaskan Athabascans
$91,668
HOUSEHOLDER INCOME AGES 25 - 44 YEARS
16.7/ 100
METRIC RATING
200th/ 347
METRIC RANK
$88,446
HOUSEHOLDER INCOME AGES 25 - 44 YEARS
3.3/ 100
METRIC RATING
230th/ 347
METRIC RANK
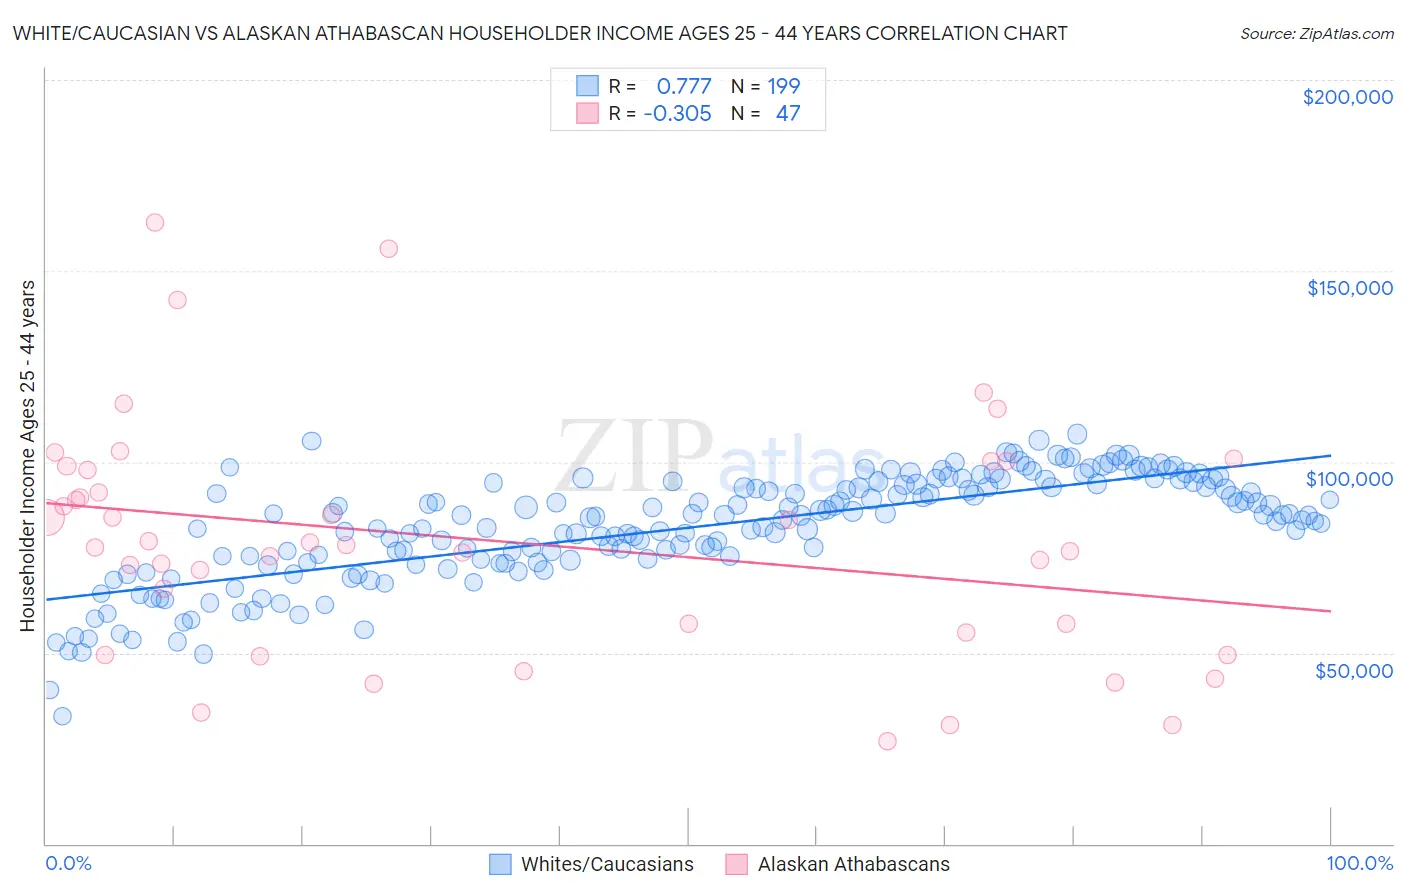
White/Caucasian vs Alaskan Athabascan Householder Income Ages 25 - 44 years Correlation Chart
The statistical analysis conducted on geographies consisting of 574,090,694 people shows a strong positive correlation between the proportion of Whites/Caucasians and household income with householder between the ages 25 and 44 in the United States with a correlation coefficient (R) of 0.777 and weighted average of $91,668. Similarly, the statistical analysis conducted on geographies consisting of 45,791,396 people shows a mild negative correlation between the proportion of Alaskan Athabascans and household income with householder between the ages 25 and 44 in the United States with a correlation coefficient (R) of -0.305 and weighted average of $88,446, a difference of 3.6%.
Householder Income Ages 25 - 44 years Correlation Summary
| Measurement | White/Caucasian | Alaskan Athabascan |
| Minimum | $33,408 | $26,875 |
| Maximum | $107,218 | $162,636 |
| Range | $73,811 | $135,761 |
| Mean | $82,806 | $79,344 |
| Median | $86,008 | $78,125 |
| Interquartile 25% (IQ1) | $74,387 | $55,208 |
| Interquartile 75% (IQ3) | $94,127 | $98,910 |
| Interquartile Range (IQR) | $19,740 | $43,702 |
| Standard Deviation (Sample) | $14,065 | $30,855 |
| Standard Deviation (Population) | $14,029 | $30,525 |
Similar Demographics by Householder Income Ages 25 - 44 years
Demographics Similar to Whites/Caucasians by Householder Income Ages 25 - 44 years
In terms of householder income ages 25 - 44 years, the demographic groups most similar to Whites/Caucasians are Kenyan ($91,684, a difference of 0.020%), Japanese ($91,624, a difference of 0.050%), Ecuadorian ($91,574, a difference of 0.10%), Immigrants from Cambodia ($91,533, a difference of 0.15%), and Nepalese ($91,498, a difference of 0.19%).
| Demographics | Rating | Rank | Householder Income Ages 25 - 44 years |
| Samoans | 23.0 /100 | #193 | Fair $92,385 |
| Immigrants | Azores | 22.4 /100 | #194 | Fair $92,322 |
| Celtics | 21.6 /100 | #195 | Fair $92,241 |
| Immigrants | Colombia | 21.3 /100 | #196 | Fair $92,204 |
| Spanish | 21.2 /100 | #197 | Fair $92,200 |
| Vietnamese | 20.2 /100 | #198 | Fair $92,089 |
| Kenyans | 16.8 /100 | #199 | Poor $91,684 |
| Whites/Caucasians | 16.7 /100 | #200 | Poor $91,668 |
| Japanese | 16.4 /100 | #201 | Poor $91,624 |
| Ecuadorians | 16.0 /100 | #202 | Poor $91,574 |
| Immigrants | Cambodia | 15.7 /100 | #203 | Poor $91,533 |
| Nepalese | 15.4 /100 | #204 | Poor $91,498 |
| Immigrants | Eastern Africa | 15.2 /100 | #205 | Poor $91,458 |
| Aleuts | 14.5 /100 | #206 | Poor $91,370 |
| Yugoslavians | 14.5 /100 | #207 | Poor $91,368 |
Demographics Similar to Alaskan Athabascans by Householder Income Ages 25 - 44 years
In terms of householder income ages 25 - 44 years, the demographic groups most similar to Alaskan Athabascans are Immigrants from Grenada ($88,311, a difference of 0.15%), Nonimmigrants ($88,301, a difference of 0.16%), Malaysian ($88,291, a difference of 0.18%), Venezuelan ($88,232, a difference of 0.24%), and Bermudan ($88,231, a difference of 0.24%).
| Demographics | Rating | Rank | Householder Income Ages 25 - 44 years |
| Immigrants | Guyana | 5.9 /100 | #223 | Tragic $89,586 |
| Barbadians | 5.9 /100 | #224 | Tragic $89,565 |
| Immigrants | Panama | 5.5 /100 | #225 | Tragic $89,451 |
| Immigrants | Iraq | 5.5 /100 | #226 | Tragic $89,444 |
| Immigrants | St. Vincent and the Grenadines | 4.1 /100 | #227 | Tragic $88,888 |
| Immigrants | Bosnia and Herzegovina | 4.0 /100 | #228 | Tragic $88,819 |
| Immigrants | Barbados | 3.7 /100 | #229 | Tragic $88,687 |
| Alaskan Athabascans | 3.3 /100 | #230 | Tragic $88,446 |
| Immigrants | Grenada | 3.0 /100 | #231 | Tragic $88,311 |
| Immigrants | Nonimmigrants | 3.0 /100 | #232 | Tragic $88,301 |
| Malaysians | 3.0 /100 | #233 | Tragic $88,291 |
| Venezuelans | 2.9 /100 | #234 | Tragic $88,232 |
| Bermudans | 2.9 /100 | #235 | Tragic $88,231 |
| Immigrants | Cameroon | 2.9 /100 | #236 | Tragic $88,214 |
| Salvadorans | 2.8 /100 | #237 | Tragic $88,198 |