Tongan vs Alaskan Athabascan Householder Income Ages 25 - 44 years

COMPARE

Tongan
Race
Ancestry
AfghanAfricanAlaska NativeAlbanianAleutAlsatianAmericanApacheArabArapahoArgentineanArmenianAssyrian/Chaldean/SyriacAustralianAustrianBahamianBangladeshiBarbadianBasqueBelgianBelizeanBermudanBhutaneseBlackfeetBolivianBrazilianBritishBritish West IndianBulgarianBurmeseCajunCambodianCanadianCape VerdeanCarpatho RusynCelticCentral AmericanCentral American IndianCherokeeCheyenneChickasawChileanChineseChippewaChoctawColombianColvilleComancheCosta RicanCreeCreekCroatianCrowCubanCypriotCzechCzechoslovakianDanishDelawareDominicanDutchDutch West IndianEastern EuropeanEcuadorianEgyptianEnglishEstonianEthiopianEuropeanFijianFilipinoFinnishFrenchFrench American IndianFrench CanadianGermanGerman RussianGhanaianGreekGuamanian/ChamorroGuatemalanGuyaneseHaitianHmongHonduranHopiHoumaHungarianIcelanderIndian (Asian)IndonesianInupiatIranianIraqiIrishIroquoisIsraeliItalianJamaicanJapaneseJordanianKenyanKiowaKoreanLaotianLatvianLebaneseLiberianLithuanianLumbeeLuxembourgerMacedonianMalaysianMalteseMarshalleseMenomineeMexicanMexican American IndianMongolianMoroccanNative HawaiianNavajoNepaleseNew ZealanderNicaraguanNigerianNorthern EuropeanNorwegianOkinawanOsageOttawaPaiutePakistaniPalestinianPanamanianParaguayanPennsylvania GermanPeruvianPimaPolishPortuguesePotawatomiPuebloPuerto RicanPuget Sound SalishRomanianRussianSalvadoranSamoanScandinavianScotch-IrishScottishSeminoleSenegaleseSerbianShoshoneSierra LeoneanSiouxSlavicSlovakSloveneSomaliSouth AfricanSouth AmericanSouth American IndianSoviet UnionSpaniardSpanishSpanish AmericanSpanish American IndianSri LankanSubsaharan AfricanSudaneseSwedishSwissSyrianTaiwaneseThaiTlingit-HaidaTohono O'OdhamTonganTrinidadian and TobagonianTsimshianTurkishU.S. Virgin IslanderUgandanUkrainianUruguayanUteVenezuelanVietnameseWelshWest IndianYakamaYaquiYugoslavianYumanYup'ikZimbabwean
Immigration
NonimmigrantsImmigrantsAfghanistanAfricaAlbaniaArgentinaArmeniaAsiaAustraliaAustriaBahamasBangladeshBarbadosBelarusBelgiumBelizeBoliviaBosnia and HerzegovinaBrazilBulgariaBurma/MyanmarCabo VerdeCambodiaCameroonCanadaCaribbeanCentral AmericaChileChinaColombiaCongoCosta RicaCroatiaCubaCzechoslovakiaDenmarkDominicaDominican RepublicEastern AfricaEastern AsiaEastern EuropeEcuadorEgyptEl SalvadorEnglandEritreaEthiopiaEuropeFijiFranceGermanyGhanaGreeceGrenadaGuatemalaGuyanaHaitiHondurasHong KongHungaryIndiaIndonesiaIranIraqIrelandIsraelItalyJamaicaJapanJordanKazakhstanKenyaKoreaKuwaitLaosLatin AmericaLatviaLebanonLiberiaLithuaniaMalaysiaMexicoMicronesiaMiddle AfricaMoldovaMoroccoNepalNetherlandsNicaraguaNigeriaNorth AmericaNorth MacedoniaNorthern AfricaNorthern EuropeNorwayOceaniaPakistanPanamaPeruPhilippinesPolandPortugalRomaniaRussiaSaudi ArabiaScotlandSenegalSerbiaSierra LeoneSingaporeSomaliaSouth AfricaSouth AmericaSouth Central AsiaSouth Eastern AsiaSouthern EuropeSpainSri LankaSt. Vincent and the GrenadinesSudanSwedenSwitzerlandSyriaTaiwanThailandTrinidad and TobagoTurkeyUgandaUkraineUruguayUzbekistanVenezuelaVietnamWest IndiesWestern AfricaWestern AsiaWestern EuropeYemenZaireZimbabweAzores
Alaskan Athabascan
Race
Ancestry
AfghanAfricanAlaska NativeAlaskan AthabascanAlbanianAleutAlsatianAmericanApacheArabArapahoArgentineanArmenianAssyrian/Chaldean/SyriacAustralianAustrianBahamianBangladeshiBarbadianBasqueBelgianBelizeanBermudanBhutaneseBlackfeetBolivianBrazilianBritishBritish West IndianBulgarianBurmeseCajunCambodianCanadianCape VerdeanCarpatho RusynCelticCentral AmericanCentral American IndianCherokeeCheyenneChickasawChileanChineseChippewaChoctawColombianColvilleComancheCosta RicanCreeCreekCroatianCrowCubanCypriotCzechCzechoslovakianDanishDelawareDominicanDutchDutch West IndianEastern EuropeanEcuadorianEgyptianEnglishEstonianEthiopianEuropeanFijianFilipinoFinnishFrenchFrench American IndianFrench CanadianGermanGerman RussianGhanaianGreekGuamanian/ChamorroGuatemalanGuyaneseHaitianHmongHonduranHopiHoumaHungarianIcelanderIndian (Asian)IndonesianInupiatIranianIraqiIrishIroquoisIsraeliItalianJamaicanJapaneseJordanianKenyanKiowaKoreanLaotianLatvianLebaneseLiberianLithuanianLumbeeLuxembourgerMacedonianMalaysianMalteseMarshalleseMenomineeMexicanMexican American IndianMongolianMoroccanNative HawaiianNavajoNepaleseNew ZealanderNicaraguanNigerianNorthern EuropeanNorwegianOkinawanOsageOttawaPaiutePakistaniPalestinianPanamanianParaguayanPennsylvania GermanPeruvianPimaPolishPortuguesePotawatomiPuebloPuerto RicanPuget Sound SalishRomanianRussianSalvadoranSamoanScandinavianScotch-IrishScottishSeminoleSenegaleseSerbianShoshoneSierra LeoneanSiouxSlavicSlovakSloveneSomaliSouth AfricanSouth AmericanSouth American IndianSoviet UnionSpaniardSpanishSpanish AmericanSpanish American IndianSri LankanSubsaharan AfricanSudaneseSwedishSwissSyrianTaiwaneseThaiTlingit-HaidaTohono O'OdhamTrinidadian and TobagonianTsimshianTurkishU.S. Virgin IslanderUgandanUkrainianUruguayanUteVenezuelanVietnameseWelshWest IndianYakamaYaquiYugoslavianYumanYup'ikZimbabwean
Immigration
NonimmigrantsImmigrantsAfghanistanAfricaAlbaniaArgentinaArmeniaAsiaAustraliaAustriaBahamasBangladeshBarbadosBelarusBelgiumBelizeBoliviaBosnia and HerzegovinaBrazilBulgariaBurma/MyanmarCabo VerdeCambodiaCameroonCanadaCaribbeanCentral AmericaChileChinaColombiaCongoCosta RicaCroatiaCubaCzechoslovakiaDenmarkDominicaDominican RepublicEastern AfricaEastern AsiaEastern EuropeEcuadorEgyptEl SalvadorEnglandEritreaEthiopiaEuropeFijiFranceGermanyGhanaGreeceGrenadaGuatemalaGuyanaHaitiHondurasHong KongHungaryIndiaIndonesiaIranIraqIrelandIsraelItalyJamaicaJapanJordanKazakhstanKenyaKoreaKuwaitLaosLatin AmericaLatviaLebanonLiberiaLithuaniaMalaysiaMexicoMicronesiaMiddle AfricaMoldovaMoroccoNepalNetherlandsNicaraguaNigeriaNorth AmericaNorth MacedoniaNorthern AfricaNorthern EuropeNorwayOceaniaPakistanPanamaPeruPhilippinesPolandPortugalRomaniaRussiaSaudi ArabiaScotlandSenegalSerbiaSierra LeoneSingaporeSomaliaSouth AfricaSouth AmericaSouth Central AsiaSouth Eastern AsiaSouthern EuropeSpainSri LankaSt. Vincent and the GrenadinesSudanSwedenSwitzerlandSyriaTaiwanThailandTrinidad and TobagoTurkeyUgandaUkraineUruguayUzbekistanVenezuelaVietnamWest IndiesWestern AfricaWestern AsiaWestern EuropeYemenZaireZimbabweAzores
Householder Income Ages 25 - 44 years
Income
Poverty
Unemployment
Labor Participation
Family Structure
Vehicle Availability
Education Level
Disability

Householder Income Ages 25 - 44 years Comparison

Tongans

Alaskan Athabascans

Exceptional
Tragic
$99,604
HOUSEHOLDER INCOME AGES 25 - 44 YEARS
94.2/ 100
METRIC RATING
113th/ 347
METRIC RANK
$88,446
HOUSEHOLDER INCOME AGES 25 - 44 YEARS
3.3/ 100
METRIC RATING
230th/ 347
METRIC RANK

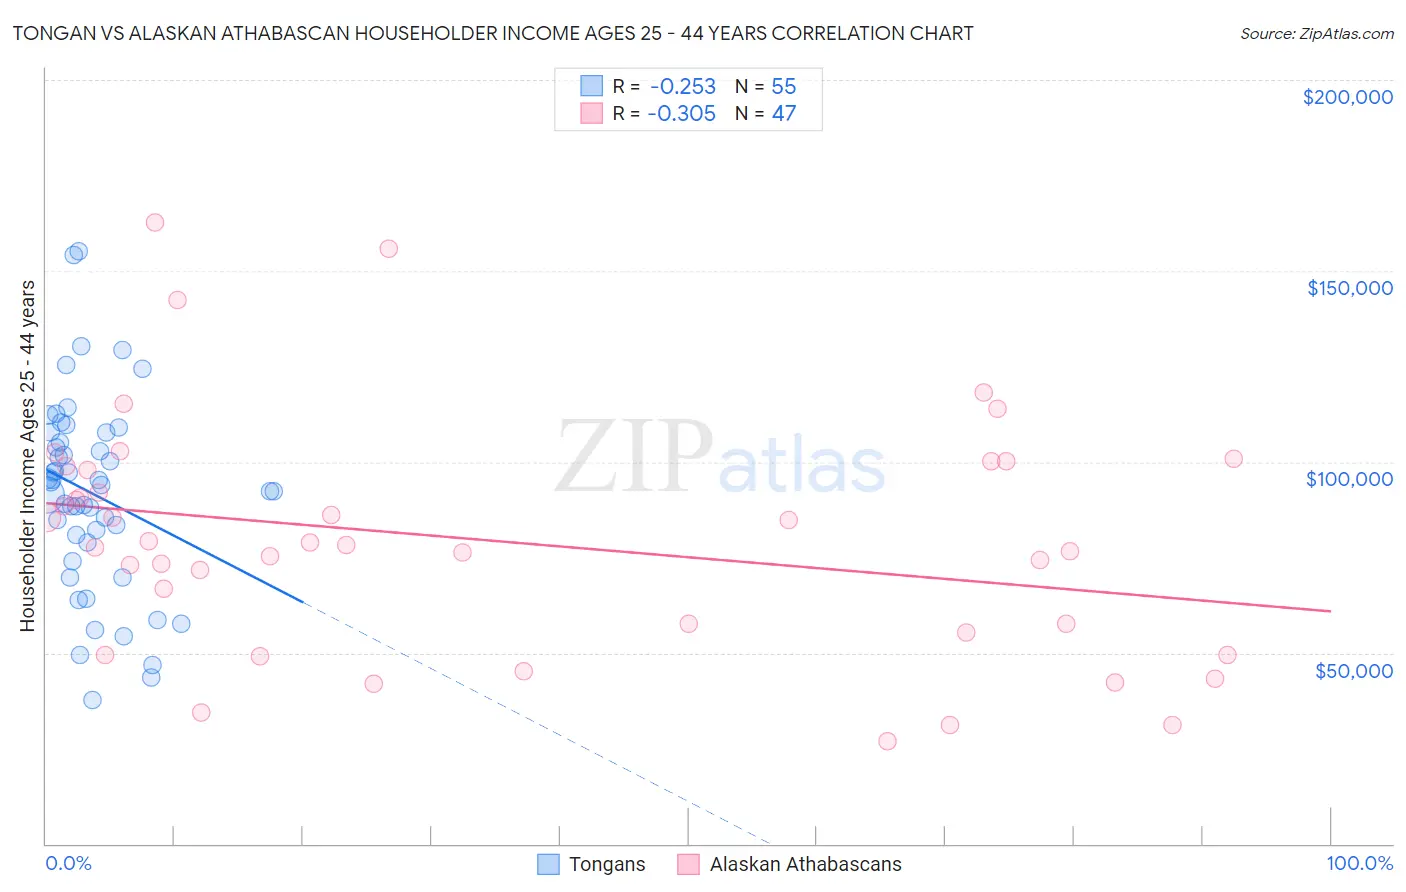
Tongan vs Alaskan Athabascan Householder Income Ages 25 - 44 years Correlation Chart

The statistical analysis conducted on geographies consisting of 102,745,884 people shows a weak negative correlation between the proportion of Tongans and household income with householder between the ages 25 and 44 in the United States with a correlation coefficient (R) of -0.253 and weighted average of $99,604. Similarly, the statistical analysis conducted on geographies consisting of 45,791,396 people shows a mild negative correlation between the proportion of Alaskan Athabascans and household income with householder between the ages 25 and 44 in the United States with a correlation coefficient (R) of -0.305 and weighted average of $88,446, a difference of 12.6%.
Tongan vs Alaskan Athabascan Householder Income Ages 25 - 44 years

Householder Income Ages 25 - 44 years Correlation Summary

MeasurementTonganAlaskan Athabascan
Minimum$37,778$26,875
Maximum$155,050$162,636
Range$117,272$135,761
Mean$91,685$79,344
Median$93,885$78,125
Interquartile 25% (IQ1)$78,849$55,208
Interquartile 75% (IQ3)$107,550$98,910
Interquartile Range (IQR)$28,701$43,702
Standard Deviation (Sample)$25,126$30,855
Standard Deviation (Population)$24,896$30,525

Similar Demographics by Householder Income Ages 25 - 44 years

Demographics Similar to Tongans by Householder Income Ages 25 - 44 years

In terms of householder income ages 25 - 44 years, the demographic groups most similar to Tongans are Polish ($99,685, a difference of 0.080%), Immigrants from Western Asia ($99,516, a difference of 0.090%), Carpatho Rusyn ($99,449, a difference of 0.16%), Portuguese ($99,429, a difference of 0.18%), and Chilean ($99,900, a difference of 0.30%).
DemographicsRating | RankHouseholder Income Ages 25 - 44 years
Immigrants | Brazil
96.5
/100
|
#106
Exceptional
$100,534
Northern Europeans
96.3
/100
|
#107
Exceptional
$100,457
Immigrants | South Eastern Asia
96.0
/100
|
#108
Exceptional
$100,283
Immigrants | North Macedonia
95.6
/100
|
#109
Exceptional
$100,101
Immigrants | Afghanistan
95.3
/100
|
#110
Exceptional
$99,977
Chileans
95.1
/100
|
#111
Exceptional
$99,900
Poles
94.5
/100
|
#112
Exceptional
$99,685
Tongans
94.2
/100
|
#113
Exceptional
$99,604
Immigrants | Western Asia
94.0
/100
|
#114
Exceptional
$99,516
Carpatho Rusyns
93.7
/100
|
#115
Exceptional
$99,449
Portuguese
93.7
/100
|
#116
Exceptional
$99,429
Immigrants | Northern Africa
93.0
/100
|
#117
Exceptional
$99,232
Syrians
92.9
/100
|
#118
Exceptional
$99,215
Jordanians
92.8
/100
|
#119
Exceptional
$99,186
Swedes
92.7
/100
|
#120
Exceptional
$99,136

Demographics Similar to Alaskan Athabascans by Householder Income Ages 25 - 44 years

In terms of householder income ages 25 - 44 years, the demographic groups most similar to Alaskan Athabascans are Immigrants from Grenada ($88,311, a difference of 0.15%), Nonimmigrants ($88,301, a difference of 0.16%), Malaysian ($88,291, a difference of 0.18%), Venezuelan ($88,232, a difference of 0.24%), and Bermudan ($88,231, a difference of 0.24%).
DemographicsRating | RankHouseholder Income Ages 25 - 44 years
Immigrants | Guyana
5.9
/100
|
#223
Tragic
$89,586
Barbadians
5.9
/100
|
#224
Tragic
$89,565
Immigrants | Panama
5.5
/100
|
#225
Tragic
$89,451
Immigrants | Iraq
5.5
/100
|
#226
Tragic
$89,444
Immigrants | St. Vincent and the Grenadines
4.1
/100
|
#227
Tragic
$88,888
Immigrants | Bosnia and Herzegovina
4.0
/100
|
#228
Tragic
$88,819
Immigrants | Barbados
3.7
/100
|
#229
Tragic
$88,687
Alaskan Athabascans
3.3
/100
|
#230
Tragic
$88,446
Immigrants | Grenada
3.0
/100
|
#231
Tragic
$88,311
Immigrants | Nonimmigrants
3.0
/100
|
#232
Tragic
$88,301
Malaysians
3.0
/100
|
#233
Tragic
$88,291
Venezuelans
2.9
/100
|
#234
Tragic
$88,232
Bermudans
2.9
/100
|
#235
Tragic
$88,231
Immigrants | Cameroon
2.9
/100
|
#236
Tragic
$88,214
Salvadorans
2.8
/100
|
#237
Tragic
$88,198