White/Caucasian vs Immigrants from Western Asia Householder Income Ages 25 - 44 years
COMPARE
White/Caucasian
Immigrants from Western Asia
Householder Income Ages 25 - 44 years
Householder Income Ages 25 - 44 years Comparison
Whites/Caucasians
Immigrants from Western Asia
$91,668
HOUSEHOLDER INCOME AGES 25 - 44 YEARS
16.7/ 100
METRIC RATING
200th/ 347
METRIC RANK
$99,516
HOUSEHOLDER INCOME AGES 25 - 44 YEARS
94.0/ 100
METRIC RATING
114th/ 347
METRIC RANK
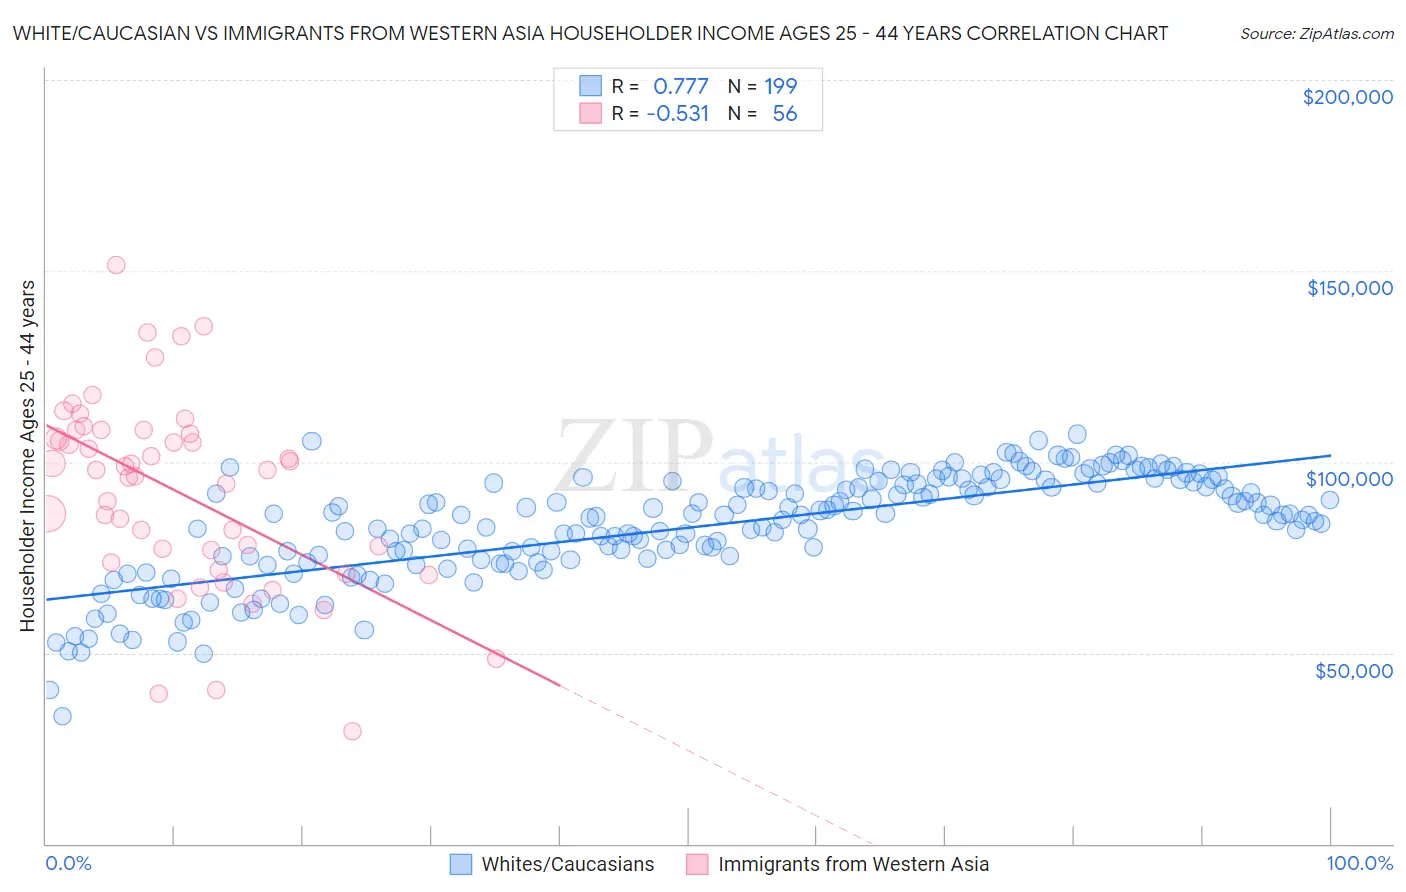
White/Caucasian vs Immigrants from Western Asia Householder Income Ages 25 - 44 years Correlation Chart
The statistical analysis conducted on geographies consisting of 574,090,694 people shows a strong positive correlation between the proportion of Whites/Caucasians and household income with householder between the ages 25 and 44 in the United States with a correlation coefficient (R) of 0.777 and weighted average of $91,668. Similarly, the statistical analysis conducted on geographies consisting of 403,414,437 people shows a substantial negative correlation between the proportion of Immigrants from Western Asia and household income with householder between the ages 25 and 44 in the United States with a correlation coefficient (R) of -0.531 and weighted average of $99,516, a difference of 8.6%.
Householder Income Ages 25 - 44 years Correlation Summary
| Measurement | White/Caucasian | Immigrants from Western Asia |
| Minimum | $33,408 | $29,492 |
| Maximum | $107,218 | $151,438 |
| Range | $73,811 | $121,946 |
| Mean | $82,806 | $92,165 |
| Median | $86,008 | $97,998 |
| Interquartile 25% (IQ1) | $74,387 | $75,153 |
| Interquartile 75% (IQ3) | $94,127 | $107,722 |
| Interquartile Range (IQR) | $19,740 | $32,569 |
| Standard Deviation (Sample) | $14,065 | $24,816 |
| Standard Deviation (Population) | $14,029 | $24,593 |
Similar Demographics by Householder Income Ages 25 - 44 years
Demographics Similar to Whites/Caucasians by Householder Income Ages 25 - 44 years
In terms of householder income ages 25 - 44 years, the demographic groups most similar to Whites/Caucasians are Kenyan ($91,684, a difference of 0.020%), Japanese ($91,624, a difference of 0.050%), Ecuadorian ($91,574, a difference of 0.10%), Immigrants from Cambodia ($91,533, a difference of 0.15%), and Nepalese ($91,498, a difference of 0.19%).
| Demographics | Rating | Rank | Householder Income Ages 25 - 44 years |
| Samoans | 23.0 /100 | #193 | Fair $92,385 |
| Immigrants | Azores | 22.4 /100 | #194 | Fair $92,322 |
| Celtics | 21.6 /100 | #195 | Fair $92,241 |
| Immigrants | Colombia | 21.3 /100 | #196 | Fair $92,204 |
| Spanish | 21.2 /100 | #197 | Fair $92,200 |
| Vietnamese | 20.2 /100 | #198 | Fair $92,089 |
| Kenyans | 16.8 /100 | #199 | Poor $91,684 |
| Whites/Caucasians | 16.7 /100 | #200 | Poor $91,668 |
| Japanese | 16.4 /100 | #201 | Poor $91,624 |
| Ecuadorians | 16.0 /100 | #202 | Poor $91,574 |
| Immigrants | Cambodia | 15.7 /100 | #203 | Poor $91,533 |
| Nepalese | 15.4 /100 | #204 | Poor $91,498 |
| Immigrants | Eastern Africa | 15.2 /100 | #205 | Poor $91,458 |
| Aleuts | 14.5 /100 | #206 | Poor $91,370 |
| Yugoslavians | 14.5 /100 | #207 | Poor $91,368 |
Demographics Similar to Immigrants from Western Asia by Householder Income Ages 25 - 44 years
In terms of householder income ages 25 - 44 years, the demographic groups most similar to Immigrants from Western Asia are Carpatho Rusyn ($99,449, a difference of 0.070%), Tongan ($99,604, a difference of 0.090%), Portuguese ($99,429, a difference of 0.090%), Polish ($99,685, a difference of 0.17%), and Immigrants from Northern Africa ($99,232, a difference of 0.29%).
| Demographics | Rating | Rank | Householder Income Ages 25 - 44 years |
| Northern Europeans | 96.3 /100 | #107 | Exceptional $100,457 |
| Immigrants | South Eastern Asia | 96.0 /100 | #108 | Exceptional $100,283 |
| Immigrants | North Macedonia | 95.6 /100 | #109 | Exceptional $100,101 |
| Immigrants | Afghanistan | 95.3 /100 | #110 | Exceptional $99,977 |
| Chileans | 95.1 /100 | #111 | Exceptional $99,900 |
| Poles | 94.5 /100 | #112 | Exceptional $99,685 |
| Tongans | 94.2 /100 | #113 | Exceptional $99,604 |
| Immigrants | Western Asia | 94.0 /100 | #114 | Exceptional $99,516 |
| Carpatho Rusyns | 93.7 /100 | #115 | Exceptional $99,449 |
| Portuguese | 93.7 /100 | #116 | Exceptional $99,429 |
| Immigrants | Northern Africa | 93.0 /100 | #117 | Exceptional $99,232 |
| Syrians | 92.9 /100 | #118 | Exceptional $99,215 |
| Jordanians | 92.8 /100 | #119 | Exceptional $99,186 |
| Swedes | 92.7 /100 | #120 | Exceptional $99,136 |
| Peruvians | 91.7 /100 | #121 | Exceptional $98,886 |