Salvadoran vs Alaskan Athabascan Householder Income Ages 25 - 44 years
COMPARE
Salvadoran
Alaskan Athabascan
Householder Income Ages 25 - 44 years
Householder Income Ages 25 - 44 years Comparison
Salvadorans
Alaskan Athabascans
$88,198
HOUSEHOLDER INCOME AGES 25 - 44 YEARS
2.8/ 100
METRIC RATING
237th/ 347
METRIC RANK
$88,446
HOUSEHOLDER INCOME AGES 25 - 44 YEARS
3.3/ 100
METRIC RATING
230th/ 347
METRIC RANK
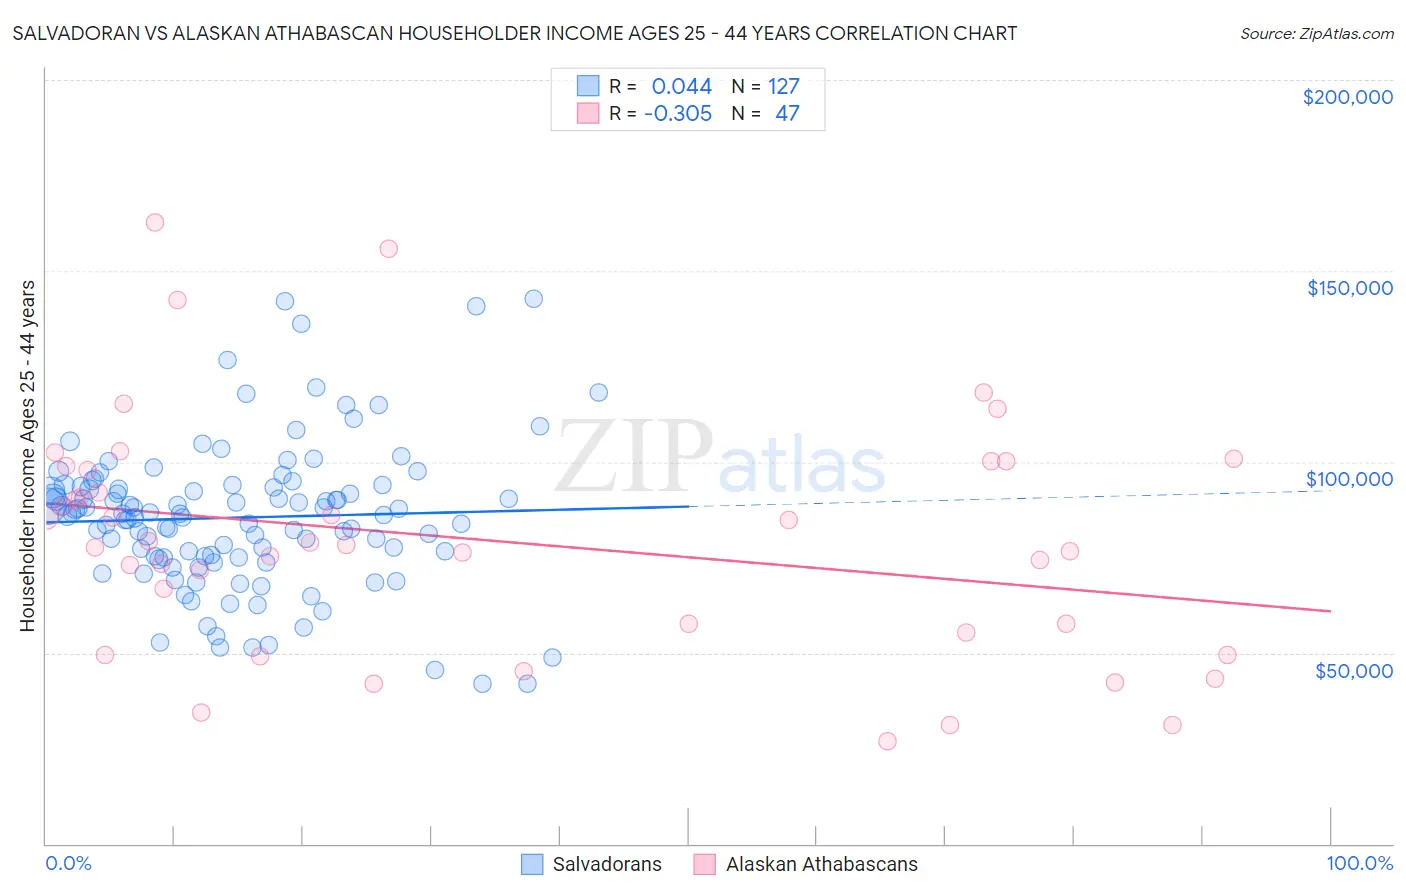
Salvadoran vs Alaskan Athabascan Householder Income Ages 25 - 44 years Correlation Chart
The statistical analysis conducted on geographies consisting of 398,111,832 people shows no correlation between the proportion of Salvadorans and household income with householder between the ages 25 and 44 in the United States with a correlation coefficient (R) of 0.044 and weighted average of $88,198. Similarly, the statistical analysis conducted on geographies consisting of 45,791,396 people shows a mild negative correlation between the proportion of Alaskan Athabascans and household income with householder between the ages 25 and 44 in the United States with a correlation coefficient (R) of -0.305 and weighted average of $88,446, a difference of 0.28%.
Householder Income Ages 25 - 44 years Correlation Summary
| Measurement | Salvadoran | Alaskan Athabascan |
| Minimum | $41,885 | $26,875 |
| Maximum | $142,639 | $162,636 |
| Range | $100,754 | $135,761 |
| Mean | $85,407 | $79,344 |
| Median | $86,364 | $78,125 |
| Interquartile 25% (IQ1) | $74,962 | $55,208 |
| Interquartile 75% (IQ3) | $93,567 | $98,910 |
| Interquartile Range (IQR) | $18,605 | $43,702 |
| Standard Deviation (Sample) | $18,999 | $30,855 |
| Standard Deviation (Population) | $18,924 | $30,525 |
Demographics Similar to Salvadorans and Alaskan Athabascans by Householder Income Ages 25 - 44 years
In terms of householder income ages 25 - 44 years, the demographic groups most similar to Salvadorans are Immigrants from Cameroon ($88,214, a difference of 0.020%), Venezuelan ($88,232, a difference of 0.040%), Bermudan ($88,231, a difference of 0.040%), Malaysian ($88,291, a difference of 0.11%), and Nonimmigrants ($88,301, a difference of 0.12%). Similarly, the demographic groups most similar to Alaskan Athabascans are Immigrants from Grenada ($88,311, a difference of 0.15%), Nonimmigrants ($88,301, a difference of 0.16%), Malaysian ($88,291, a difference of 0.18%), Venezuelan ($88,232, a difference of 0.24%), and Bermudan ($88,231, a difference of 0.24%).
| Demographics | Rating | Rank | Householder Income Ages 25 - 44 years |
| Immigrants | Guyana | 5.9 /100 | #223 | Tragic $89,586 |
| Barbadians | 5.9 /100 | #224 | Tragic $89,565 |
| Immigrants | Panama | 5.5 /100 | #225 | Tragic $89,451 |
| Immigrants | Iraq | 5.5 /100 | #226 | Tragic $89,444 |
| Immigrants | St. Vincent and the Grenadines | 4.1 /100 | #227 | Tragic $88,888 |
| Immigrants | Bosnia and Herzegovina | 4.0 /100 | #228 | Tragic $88,819 |
| Immigrants | Barbados | 3.7 /100 | #229 | Tragic $88,687 |
| Alaskan Athabascans | 3.3 /100 | #230 | Tragic $88,446 |
| Immigrants | Grenada | 3.0 /100 | #231 | Tragic $88,311 |
| Immigrants | Nonimmigrants | 3.0 /100 | #232 | Tragic $88,301 |
| Malaysians | 3.0 /100 | #233 | Tragic $88,291 |
| Venezuelans | 2.9 /100 | #234 | Tragic $88,232 |
| Bermudans | 2.9 /100 | #235 | Tragic $88,231 |
| Immigrants | Cameroon | 2.9 /100 | #236 | Tragic $88,214 |
| Salvadorans | 2.8 /100 | #237 | Tragic $88,198 |
| Alaska Natives | 2.6 /100 | #238 | Tragic $88,018 |
| Immigrants | Ghana | 2.2 /100 | #239 | Tragic $87,760 |
| Nicaraguans | 2.2 /100 | #240 | Tragic $87,751 |
| Nigerians | 2.2 /100 | #241 | Tragic $87,730 |
| West Indians | 1.7 /100 | #242 | Tragic $87,205 |
| Immigrants | West Indies | 1.5 /100 | #243 | Tragic $87,063 |