South American Indian vs Alaskan Athabascan Householder Income Ages 25 - 44 years
COMPARE
South American Indian
Alaskan Athabascan
Householder Income Ages 25 - 44 years
Householder Income Ages 25 - 44 years Comparison
South American Indians
Alaskan Athabascans
$96,497
HOUSEHOLDER INCOME AGES 25 - 44 YEARS
74.5/ 100
METRIC RATING
152nd/ 347
METRIC RANK
$88,446
HOUSEHOLDER INCOME AGES 25 - 44 YEARS
3.3/ 100
METRIC RATING
230th/ 347
METRIC RANK
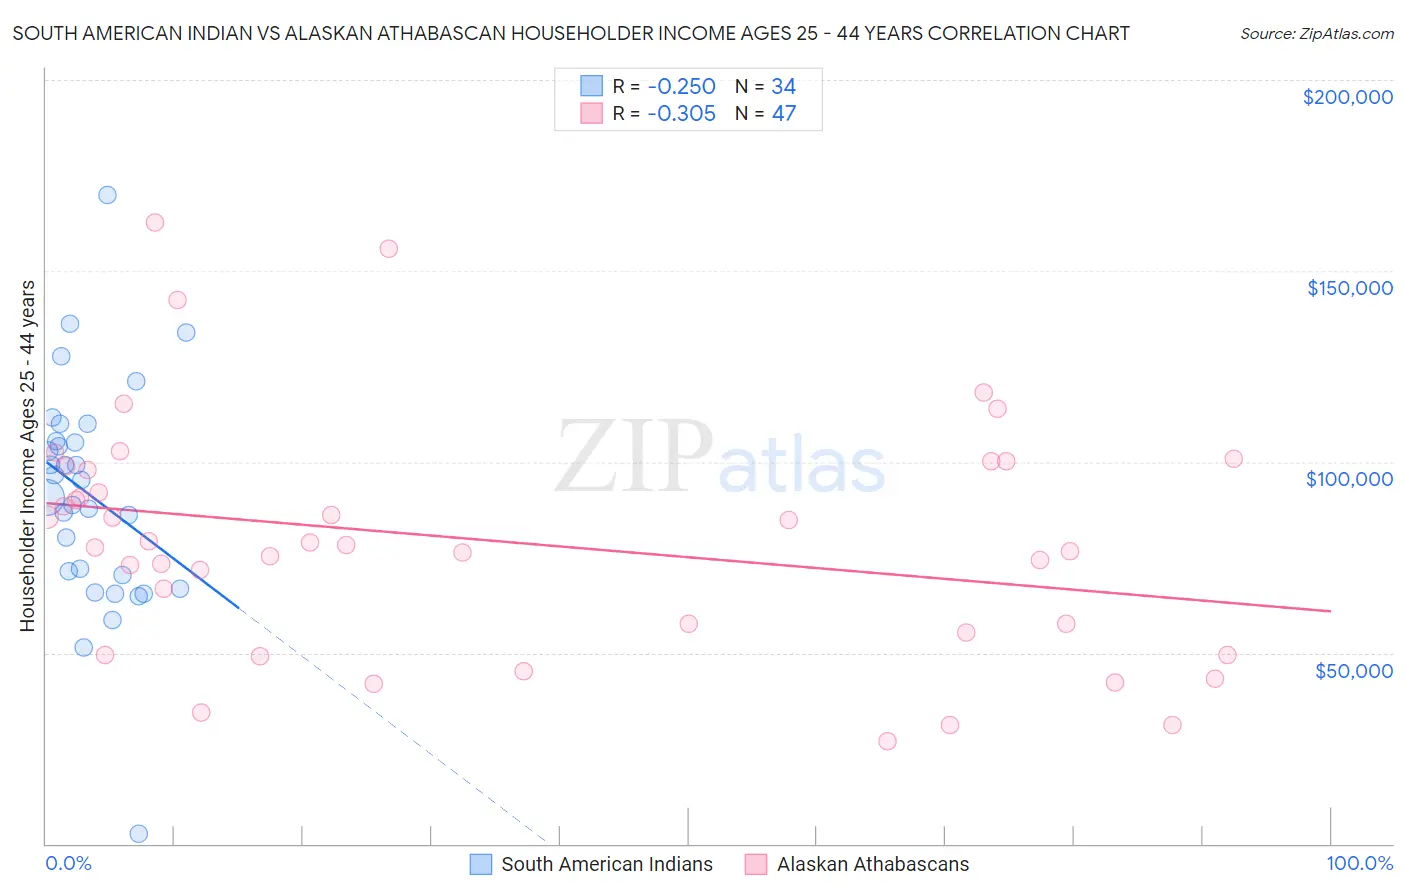
South American Indian vs Alaskan Athabascan Householder Income Ages 25 - 44 years Correlation Chart
The statistical analysis conducted on geographies consisting of 164,455,741 people shows a weak negative correlation between the proportion of South American Indians and household income with householder between the ages 25 and 44 in the United States with a correlation coefficient (R) of -0.250 and weighted average of $96,497. Similarly, the statistical analysis conducted on geographies consisting of 45,791,396 people shows a mild negative correlation between the proportion of Alaskan Athabascans and household income with householder between the ages 25 and 44 in the United States with a correlation coefficient (R) of -0.305 and weighted average of $88,446, a difference of 9.1%.
Householder Income Ages 25 - 44 years Correlation Summary
| Measurement | South American Indian | Alaskan Athabascan |
| Minimum | $2,499 | $26,875 |
| Maximum | $170,036 | $162,636 |
| Range | $167,537 | $135,761 |
| Mean | $91,221 | $79,344 |
| Median | $92,899 | $78,125 |
| Interquartile 25% (IQ1) | $70,385 | $55,208 |
| Interquartile 75% (IQ3) | $105,466 | $98,910 |
| Interquartile Range (IQR) | $35,081 | $43,702 |
| Standard Deviation (Sample) | $29,879 | $30,855 |
| Standard Deviation (Population) | $29,437 | $30,525 |
Similar Demographics by Householder Income Ages 25 - 44 years
Demographics Similar to South American Indians by Householder Income Ages 25 - 44 years
In terms of householder income ages 25 - 44 years, the demographic groups most similar to South American Indians are Czech ($96,525, a difference of 0.030%), Slovene ($96,439, a difference of 0.060%), Slavic ($96,377, a difference of 0.12%), Ugandan ($96,667, a difference of 0.18%), and Basque ($96,709, a difference of 0.22%).
| Demographics | Rating | Rank | Householder Income Ages 25 - 44 years |
| Norwegians | 78.2 /100 | #145 | Good $96,866 |
| Ethiopians | 77.8 /100 | #146 | Good $96,824 |
| Immigrants | Syria | 77.4 /100 | #147 | Good $96,789 |
| Irish | 76.9 /100 | #148 | Good $96,730 |
| Basques | 76.6 /100 | #149 | Good $96,709 |
| Ugandans | 76.2 /100 | #150 | Good $96,667 |
| Czechs | 74.8 /100 | #151 | Good $96,525 |
| South American Indians | 74.5 /100 | #152 | Good $96,497 |
| Slovenes | 73.9 /100 | #153 | Good $96,439 |
| Slavs | 73.2 /100 | #154 | Good $96,377 |
| Moroccans | 70.3 /100 | #155 | Good $96,117 |
| Immigrants | Germany | 67.9 /100 | #156 | Good $95,913 |
| Immigrants | Uganda | 65.2 /100 | #157 | Good $95,698 |
| Scandinavians | 63.9 /100 | #158 | Good $95,596 |
| Costa Ricans | 63.5 /100 | #159 | Good $95,565 |
Demographics Similar to Alaskan Athabascans by Householder Income Ages 25 - 44 years
In terms of householder income ages 25 - 44 years, the demographic groups most similar to Alaskan Athabascans are Immigrants from Grenada ($88,311, a difference of 0.15%), Nonimmigrants ($88,301, a difference of 0.16%), Malaysian ($88,291, a difference of 0.18%), Venezuelan ($88,232, a difference of 0.24%), and Bermudan ($88,231, a difference of 0.24%).
| Demographics | Rating | Rank | Householder Income Ages 25 - 44 years |
| Immigrants | Guyana | 5.9 /100 | #223 | Tragic $89,586 |
| Barbadians | 5.9 /100 | #224 | Tragic $89,565 |
| Immigrants | Panama | 5.5 /100 | #225 | Tragic $89,451 |
| Immigrants | Iraq | 5.5 /100 | #226 | Tragic $89,444 |
| Immigrants | St. Vincent and the Grenadines | 4.1 /100 | #227 | Tragic $88,888 |
| Immigrants | Bosnia and Herzegovina | 4.0 /100 | #228 | Tragic $88,819 |
| Immigrants | Barbados | 3.7 /100 | #229 | Tragic $88,687 |
| Alaskan Athabascans | 3.3 /100 | #230 | Tragic $88,446 |
| Immigrants | Grenada | 3.0 /100 | #231 | Tragic $88,311 |
| Immigrants | Nonimmigrants | 3.0 /100 | #232 | Tragic $88,301 |
| Malaysians | 3.0 /100 | #233 | Tragic $88,291 |
| Venezuelans | 2.9 /100 | #234 | Tragic $88,232 |
| Bermudans | 2.9 /100 | #235 | Tragic $88,231 |
| Immigrants | Cameroon | 2.9 /100 | #236 | Tragic $88,214 |
| Salvadorans | 2.8 /100 | #237 | Tragic $88,198 |