Colombian vs Israeli Median Female Earnings
COMPARE
Colombian
Israeli
Median Female Earnings
Median Female Earnings Comparison
Colombians
Israelis
$39,439
MEDIAN FEMALE EARNINGS
36.9/ 100
METRIC RATING
186th/ 347
METRIC RANK
$43,852
MEDIAN FEMALE EARNINGS
100.0/ 100
METRIC RATING
39th/ 347
METRIC RANK
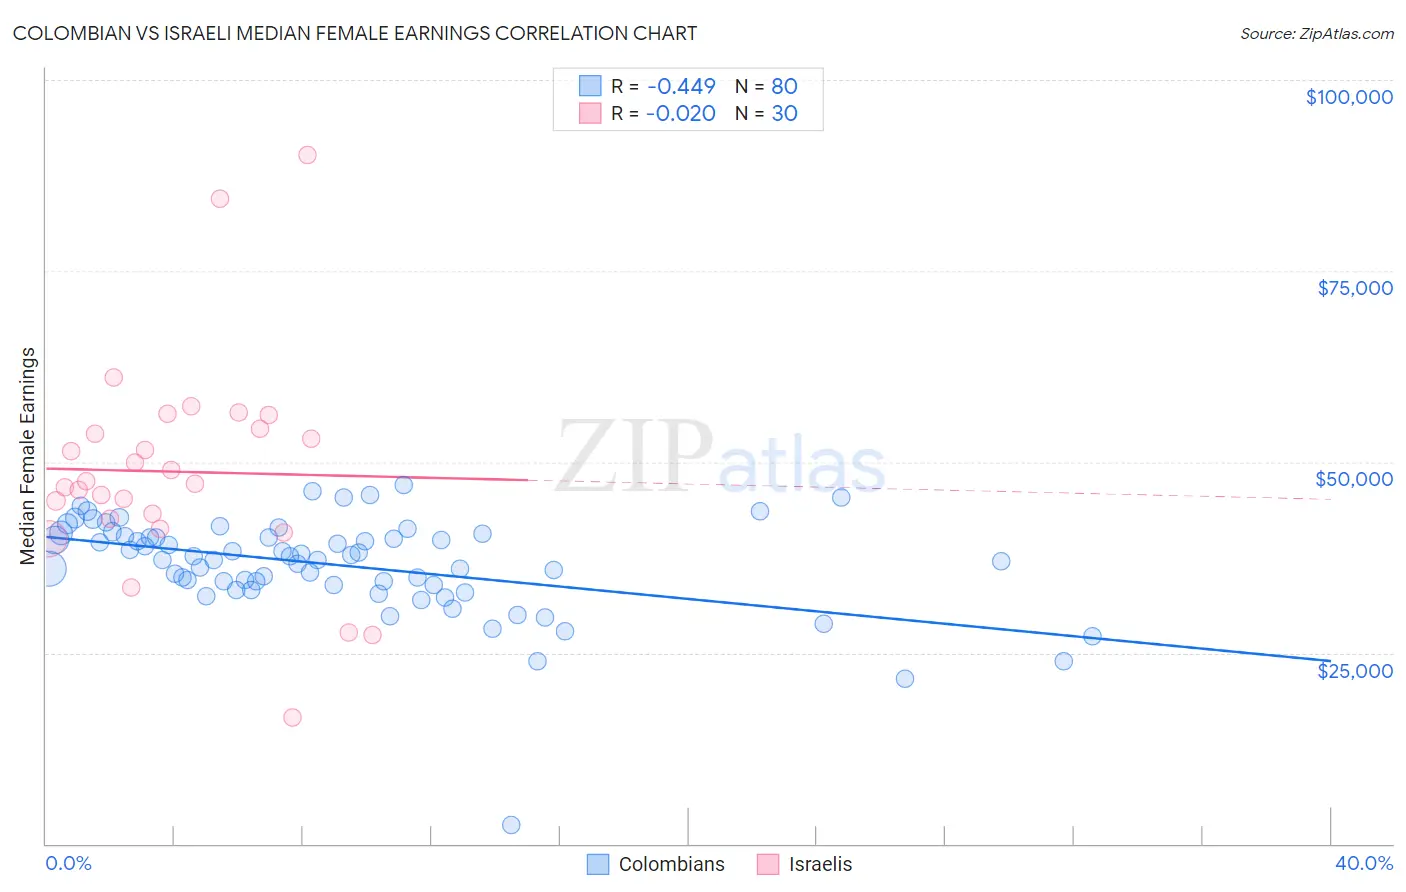
Colombian vs Israeli Median Female Earnings Correlation Chart
The statistical analysis conducted on geographies consisting of 419,536,375 people shows a moderate negative correlation between the proportion of Colombians and median female earnings in the United States with a correlation coefficient (R) of -0.449 and weighted average of $39,439. Similarly, the statistical analysis conducted on geographies consisting of 211,198,030 people shows no correlation between the proportion of Israelis and median female earnings in the United States with a correlation coefficient (R) of -0.020 and weighted average of $43,852, a difference of 11.2%.
Median Female Earnings Correlation Summary
| Measurement | Colombian | Israeli |
| Minimum | $2,499 | $16,513 |
| Maximum | $46,974 | $90,109 |
| Range | $44,475 | $73,596 |
| Mean | $36,461 | $48,703 |
| Median | $37,418 | $47,323 |
| Interquartile 25% (IQ1) | $33,852 | $42,485 |
| Interquartile 75% (IQ3) | $40,193 | $54,278 |
| Interquartile Range (IQR) | $6,341 | $11,793 |
| Standard Deviation (Sample) | $6,518 | $14,338 |
| Standard Deviation (Population) | $6,477 | $14,097 |
Similar Demographics by Median Female Earnings
Demographics Similar to Colombians by Median Female Earnings
In terms of median female earnings, the demographic groups most similar to Colombians are Immigrants from West Indies ($39,441, a difference of 0.0%), European ($39,457, a difference of 0.040%), Swedish ($39,421, a difference of 0.050%), Bermudan ($39,418, a difference of 0.050%), and Senegalese ($39,384, a difference of 0.14%).
| Demographics | Rating | Rank | Median Female Earnings |
| Immigrants | Germany | 45.1 /100 | #179 | Average $39,603 |
| Immigrants | Kenya | 41.6 /100 | #180 | Average $39,535 |
| Tsimshian | 41.4 /100 | #181 | Average $39,530 |
| Tlingit-Haida | 40.5 /100 | #182 | Average $39,513 |
| Hungarians | 40.3 /100 | #183 | Average $39,510 |
| Europeans | 37.7 /100 | #184 | Fair $39,457 |
| Immigrants | West Indies | 36.9 /100 | #185 | Fair $39,441 |
| Colombians | 36.9 /100 | #186 | Fair $39,439 |
| Swedes | 36.0 /100 | #187 | Fair $39,421 |
| Bermudans | 35.9 /100 | #188 | Fair $39,418 |
| Senegalese | 34.2 /100 | #189 | Fair $39,384 |
| Puget Sound Salish | 33.9 /100 | #190 | Fair $39,376 |
| Immigrants | Western Africa | 32.7 /100 | #191 | Fair $39,351 |
| Immigrants | Immigrants | 31.7 /100 | #192 | Fair $39,328 |
| Immigrants | Nigeria | 30.2 /100 | #193 | Fair $39,294 |
Demographics Similar to Israelis by Median Female Earnings
In terms of median female earnings, the demographic groups most similar to Israelis are Immigrants from Malaysia ($43,835, a difference of 0.040%), Latvian ($43,941, a difference of 0.20%), Immigrants from Switzerland ($43,996, a difference of 0.33%), Bhutanese ($43,648, a difference of 0.47%), and Immigrants from Denmark ($43,646, a difference of 0.47%).
| Demographics | Rating | Rank | Median Female Earnings |
| Immigrants | Northern Europe | 100.0 /100 | #32 | Exceptional $44,366 |
| Immigrants | Asia | 100.0 /100 | #33 | Exceptional $44,198 |
| Russians | 100.0 /100 | #34 | Exceptional $44,169 |
| Immigrants | Sri Lanka | 100.0 /100 | #35 | Exceptional $44,161 |
| Immigrants | Turkey | 100.0 /100 | #36 | Exceptional $44,066 |
| Immigrants | Switzerland | 100.0 /100 | #37 | Exceptional $43,996 |
| Latvians | 100.0 /100 | #38 | Exceptional $43,941 |
| Israelis | 100.0 /100 | #39 | Exceptional $43,852 |
| Immigrants | Malaysia | 100.0 /100 | #40 | Exceptional $43,835 |
| Bhutanese | 100.0 /100 | #41 | Exceptional $43,648 |
| Immigrants | Denmark | 100.0 /100 | #42 | Exceptional $43,646 |
| Bulgarians | 100.0 /100 | #43 | Exceptional $43,638 |
| Immigrants | Czechoslovakia | 100.0 /100 | #44 | Exceptional $43,571 |
| Immigrants | Europe | 100.0 /100 | #45 | Exceptional $43,523 |
| Immigrants | Bolivia | 100.0 /100 | #46 | Exceptional $43,467 |