Welsh vs Israeli Median Family Income
COMPARE
Welsh
Israeli
Median Family Income
Median Family Income Comparison
Welsh
Israelis
$102,151
MEDIAN FAMILY INCOME
43.3/ 100
METRIC RATING
178th/ 347
METRIC RANK
$118,577
MEDIAN FAMILY INCOME
100.0/ 100
METRIC RATING
36th/ 347
METRIC RANK
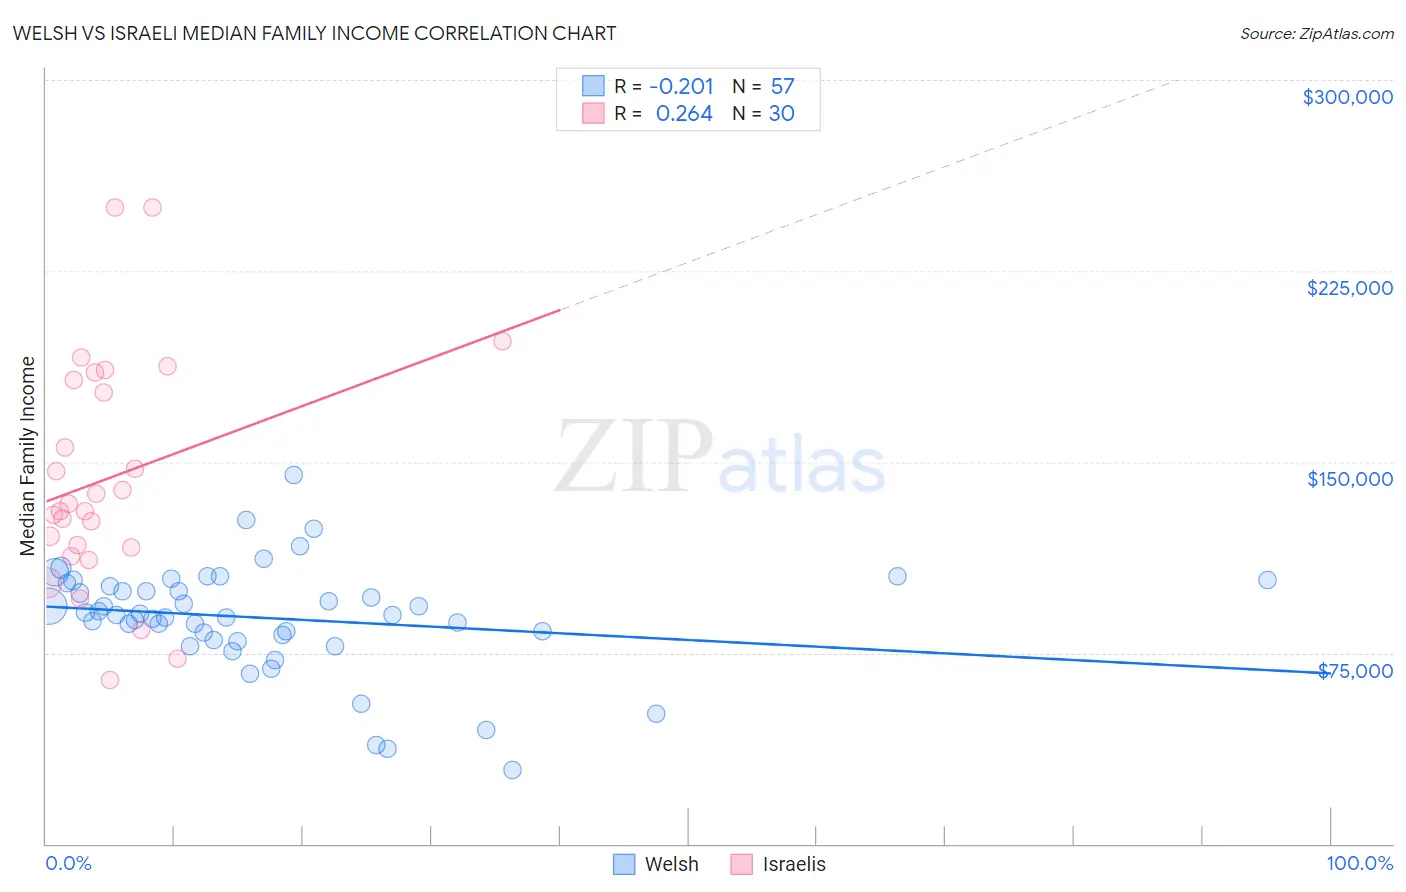
Welsh vs Israeli Median Family Income Correlation Chart
The statistical analysis conducted on geographies consisting of 527,824,493 people shows a weak negative correlation between the proportion of Welsh and median family income in the United States with a correlation coefficient (R) of -0.201 and weighted average of $102,151. Similarly, the statistical analysis conducted on geographies consisting of 210,932,899 people shows a weak positive correlation between the proportion of Israelis and median family income in the United States with a correlation coefficient (R) of 0.264 and weighted average of $118,577, a difference of 16.1%.
Median Family Income Correlation Summary
| Measurement | Welsh | Israeli |
| Minimum | $28,750 | $64,441 |
| Maximum | $145,055 | $250,001 |
| Range | $116,305 | $185,560 |
| Mean | $88,686 | $143,645 |
| Median | $89,832 | $132,084 |
| Interquartile 25% (IQ1) | $80,992 | $116,332 |
| Interquartile 75% (IQ3) | $101,775 | $182,189 |
| Interquartile Range (IQR) | $20,783 | $65,857 |
| Standard Deviation (Sample) | $21,326 | $45,469 |
| Standard Deviation (Population) | $21,138 | $44,705 |
Similar Demographics by Median Family Income
Demographics Similar to Welsh by Median Family Income
In terms of median family income, the demographic groups most similar to Welsh are German ($102,254, a difference of 0.10%), French ($102,368, a difference of 0.21%), Immigrants from Eastern Africa ($102,451, a difference of 0.29%), South American ($101,856, a difference of 0.29%), and Finnish ($102,676, a difference of 0.51%).
| Demographics | Rating | Rank | Median Family Income |
| Alsatians | 54.3 /100 | #171 | Average $103,010 |
| Immigrants | Eritrea | 51.9 /100 | #172 | Average $102,823 |
| Belgians | 51.4 /100 | #173 | Average $102,788 |
| Finns | 50.0 /100 | #174 | Average $102,676 |
| Immigrants | Eastern Africa | 47.1 /100 | #175 | Average $102,451 |
| French | 46.1 /100 | #176 | Average $102,368 |
| Germans | 44.6 /100 | #177 | Average $102,254 |
| Welsh | 43.3 /100 | #178 | Average $102,151 |
| South Americans | 39.7 /100 | #179 | Fair $101,856 |
| French Canadians | 37.0 /100 | #180 | Fair $101,634 |
| Spaniards | 36.8 /100 | #181 | Fair $101,617 |
| Tsimshian | 35.9 /100 | #182 | Fair $101,543 |
| Kenyans | 34.5 /100 | #183 | Fair $101,417 |
| Immigrants | Costa Rica | 33.7 /100 | #184 | Fair $101,354 |
| Dutch | 31.9 /100 | #185 | Fair $101,192 |
Demographics Similar to Israelis by Median Family Income
In terms of median family income, the demographic groups most similar to Israelis are Australian ($118,440, a difference of 0.12%), Immigrants from Turkey ($118,325, a difference of 0.21%), Immigrants from Asia ($118,291, a difference of 0.24%), Immigrants from Lithuania ($118,053, a difference of 0.44%), and Estonian ($118,013, a difference of 0.48%).
| Demographics | Rating | Rank | Median Family Income |
| Latvians | 100.0 /100 | #29 | Exceptional $120,301 |
| Immigrants | Sri Lanka | 100.0 /100 | #30 | Exceptional $120,263 |
| Immigrants | France | 100.0 /100 | #31 | Exceptional $120,076 |
| Asians | 100.0 /100 | #32 | Exceptional $119,955 |
| Bhutanese | 100.0 /100 | #33 | Exceptional $119,800 |
| Bolivians | 100.0 /100 | #34 | Exceptional $119,479 |
| Soviet Union | 100.0 /100 | #35 | Exceptional $119,262 |
| Israelis | 100.0 /100 | #36 | Exceptional $118,577 |
| Australians | 100.0 /100 | #37 | Exceptional $118,440 |
| Immigrants | Turkey | 100.0 /100 | #38 | Exceptional $118,325 |
| Immigrants | Asia | 100.0 /100 | #39 | Exceptional $118,291 |
| Immigrants | Lithuania | 100.0 /100 | #40 | Exceptional $118,053 |
| Estonians | 100.0 /100 | #41 | Exceptional $118,013 |
| Immigrants | Bolivia | 100.0 /100 | #42 | Exceptional $117,912 |
| Bulgarians | 100.0 /100 | #43 | Exceptional $117,818 |