Liberian vs Israeli Median Female Earnings
COMPARE
Liberian
Israeli
Median Female Earnings
Median Female Earnings Comparison
Liberians
Israelis
$38,215
MEDIAN FEMALE EARNINGS
4.4/ 100
METRIC RATING
236th/ 347
METRIC RANK
$43,852
MEDIAN FEMALE EARNINGS
100.0/ 100
METRIC RATING
39th/ 347
METRIC RANK
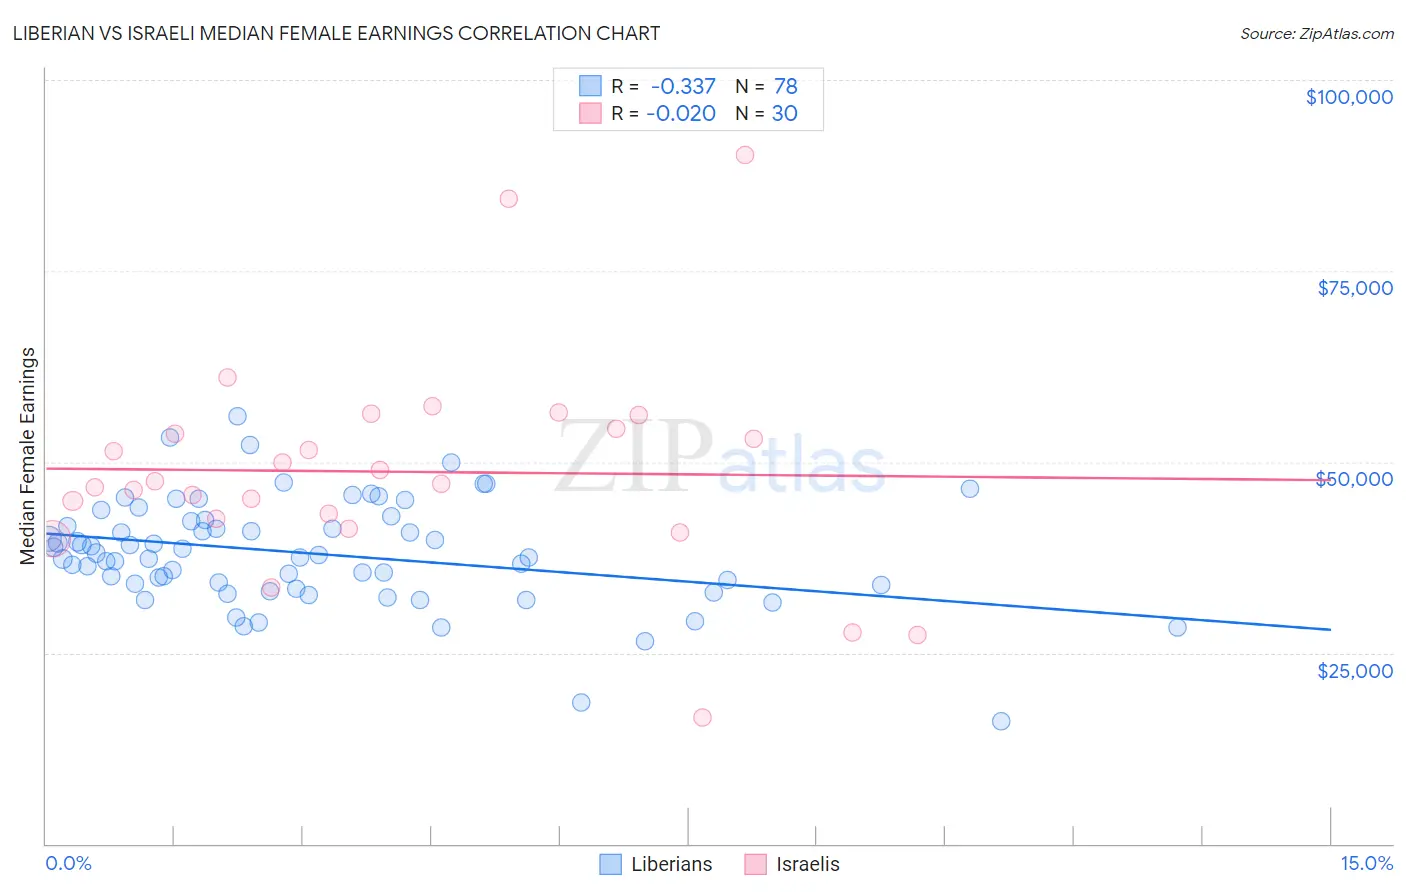
Liberian vs Israeli Median Female Earnings Correlation Chart
The statistical analysis conducted on geographies consisting of 118,095,616 people shows a mild negative correlation between the proportion of Liberians and median female earnings in the United States with a correlation coefficient (R) of -0.337 and weighted average of $38,215. Similarly, the statistical analysis conducted on geographies consisting of 211,198,030 people shows no correlation between the proportion of Israelis and median female earnings in the United States with a correlation coefficient (R) of -0.020 and weighted average of $43,852, a difference of 14.7%.
Median Female Earnings Correlation Summary
| Measurement | Liberian | Israeli |
| Minimum | $16,076 | $16,513 |
| Maximum | $56,012 | $90,109 |
| Range | $39,936 | $73,596 |
| Mean | $37,973 | $48,703 |
| Median | $37,624 | $47,323 |
| Interquartile 25% (IQ1) | $33,939 | $42,485 |
| Interquartile 75% (IQ3) | $42,173 | $54,278 |
| Interquartile Range (IQR) | $8,234 | $11,793 |
| Standard Deviation (Sample) | $6,991 | $14,338 |
| Standard Deviation (Population) | $6,946 | $14,097 |
Similar Demographics by Median Female Earnings
Demographics Similar to Liberians by Median Female Earnings
In terms of median female earnings, the demographic groups most similar to Liberians are Sudanese ($38,215, a difference of 0.0%), Immigrants from Cabo Verde ($38,208, a difference of 0.020%), Alaska Native ($38,202, a difference of 0.030%), English ($38,196, a difference of 0.050%), and Finnish ($38,173, a difference of 0.11%).
| Demographics | Rating | Rank | Median Female Earnings |
| Belgians | 6.1 /100 | #229 | Tragic $38,382 |
| Basques | 5.7 /100 | #230 | Tragic $38,352 |
| Somalis | 5.5 /100 | #231 | Tragic $38,333 |
| Scandinavians | 5.2 /100 | #232 | Tragic $38,306 |
| Tongans | 5.1 /100 | #233 | Tragic $38,288 |
| Celtics | 5.0 /100 | #234 | Tragic $38,283 |
| Sudanese | 4.4 /100 | #235 | Tragic $38,215 |
| Liberians | 4.4 /100 | #236 | Tragic $38,215 |
| Immigrants | Cabo Verde | 4.3 /100 | #237 | Tragic $38,208 |
| Alaska Natives | 4.3 /100 | #238 | Tragic $38,202 |
| English | 4.2 /100 | #239 | Tragic $38,196 |
| Finns | 4.0 /100 | #240 | Tragic $38,173 |
| Spanish | 3.5 /100 | #241 | Tragic $38,098 |
| Immigrants | Burma/Myanmar | 3.0 /100 | #242 | Tragic $38,028 |
| Germans | 2.8 /100 | #243 | Tragic $37,986 |
Demographics Similar to Israelis by Median Female Earnings
In terms of median female earnings, the demographic groups most similar to Israelis are Immigrants from Malaysia ($43,835, a difference of 0.040%), Latvian ($43,941, a difference of 0.20%), Immigrants from Switzerland ($43,996, a difference of 0.33%), Bhutanese ($43,648, a difference of 0.47%), and Immigrants from Denmark ($43,646, a difference of 0.47%).
| Demographics | Rating | Rank | Median Female Earnings |
| Immigrants | Northern Europe | 100.0 /100 | #32 | Exceptional $44,366 |
| Immigrants | Asia | 100.0 /100 | #33 | Exceptional $44,198 |
| Russians | 100.0 /100 | #34 | Exceptional $44,169 |
| Immigrants | Sri Lanka | 100.0 /100 | #35 | Exceptional $44,161 |
| Immigrants | Turkey | 100.0 /100 | #36 | Exceptional $44,066 |
| Immigrants | Switzerland | 100.0 /100 | #37 | Exceptional $43,996 |
| Latvians | 100.0 /100 | #38 | Exceptional $43,941 |
| Israelis | 100.0 /100 | #39 | Exceptional $43,852 |
| Immigrants | Malaysia | 100.0 /100 | #40 | Exceptional $43,835 |
| Bhutanese | 100.0 /100 | #41 | Exceptional $43,648 |
| Immigrants | Denmark | 100.0 /100 | #42 | Exceptional $43,646 |
| Bulgarians | 100.0 /100 | #43 | Exceptional $43,638 |
| Immigrants | Czechoslovakia | 100.0 /100 | #44 | Exceptional $43,571 |
| Immigrants | Europe | 100.0 /100 | #45 | Exceptional $43,523 |
| Immigrants | Bolivia | 100.0 /100 | #46 | Exceptional $43,467 |