Welsh vs Argentinean Median Family Income
COMPARE
Welsh
Argentinean
Median Family Income
Median Family Income Comparison
Welsh
Argentineans
$102,151
MEDIAN FAMILY INCOME
43.3/ 100
METRIC RATING
178th/ 347
METRIC RANK
$112,665
MEDIAN FAMILY INCOME
99.4/ 100
METRIC RATING
76th/ 347
METRIC RANK
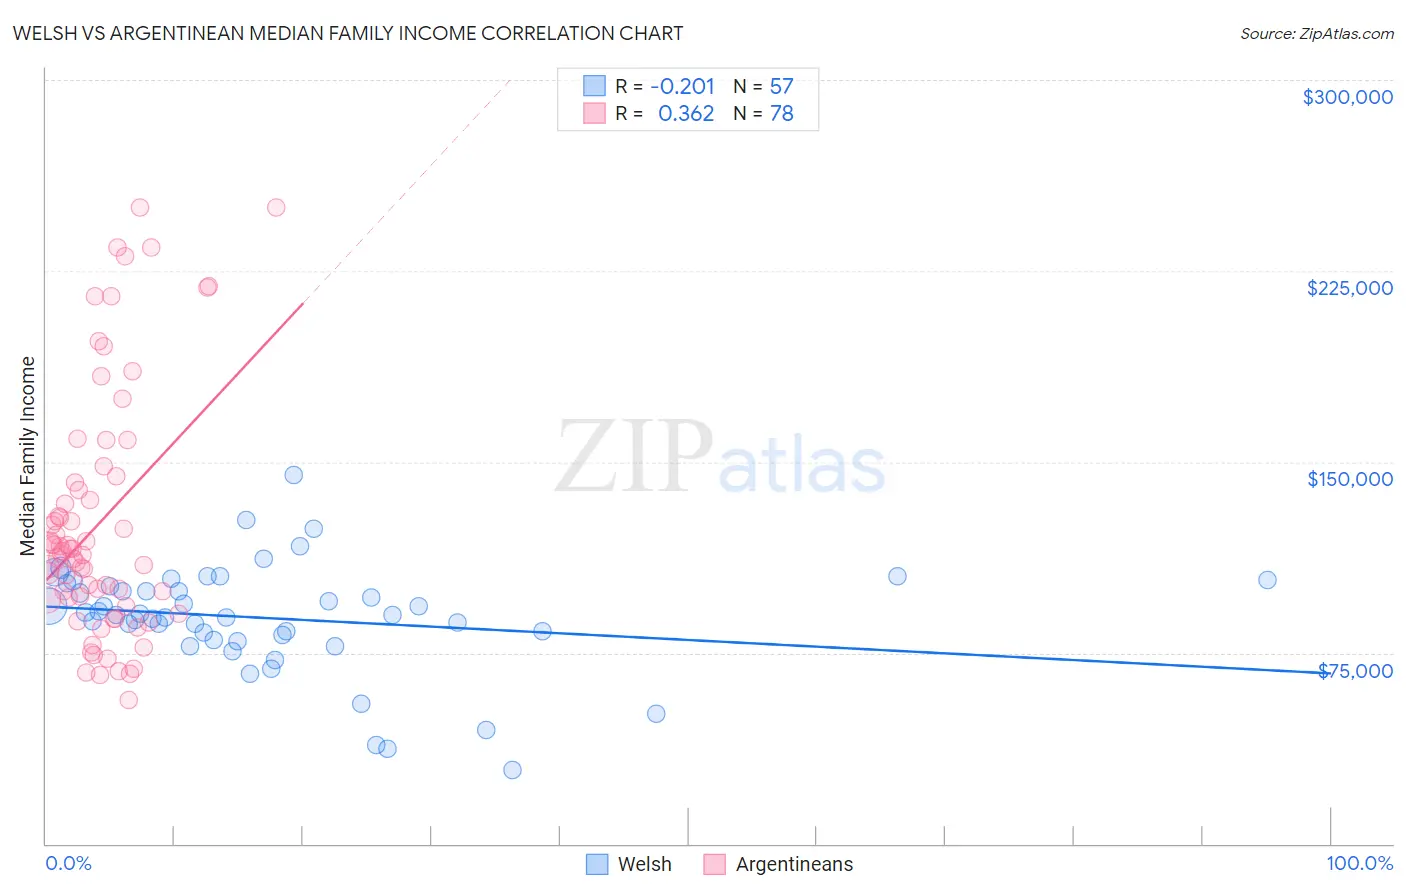
Welsh vs Argentinean Median Family Income Correlation Chart
The statistical analysis conducted on geographies consisting of 527,824,493 people shows a weak negative correlation between the proportion of Welsh and median family income in the United States with a correlation coefficient (R) of -0.201 and weighted average of $102,151. Similarly, the statistical analysis conducted on geographies consisting of 296,932,398 people shows a mild positive correlation between the proportion of Argentineans and median family income in the United States with a correlation coefficient (R) of 0.362 and weighted average of $112,665, a difference of 10.3%.
Median Family Income Correlation Summary
| Measurement | Welsh | Argentinean |
| Minimum | $28,750 | $56,696 |
| Maximum | $145,055 | $250,001 |
| Range | $116,305 | $193,305 |
| Mean | $88,686 | $126,035 |
| Median | $89,832 | $114,562 |
| Interquartile 25% (IQ1) | $80,992 | $95,780 |
| Interquartile 75% (IQ3) | $101,775 | $141,982 |
| Interquartile Range (IQR) | $20,783 | $46,202 |
| Standard Deviation (Sample) | $21,326 | $48,159 |
| Standard Deviation (Population) | $21,138 | $47,849 |
Similar Demographics by Median Family Income
Demographics Similar to Welsh by Median Family Income
In terms of median family income, the demographic groups most similar to Welsh are German ($102,254, a difference of 0.10%), French ($102,368, a difference of 0.21%), Immigrants from Eastern Africa ($102,451, a difference of 0.29%), South American ($101,856, a difference of 0.29%), and Finnish ($102,676, a difference of 0.51%).
| Demographics | Rating | Rank | Median Family Income |
| Alsatians | 54.3 /100 | #171 | Average $103,010 |
| Immigrants | Eritrea | 51.9 /100 | #172 | Average $102,823 |
| Belgians | 51.4 /100 | #173 | Average $102,788 |
| Finns | 50.0 /100 | #174 | Average $102,676 |
| Immigrants | Eastern Africa | 47.1 /100 | #175 | Average $102,451 |
| French | 46.1 /100 | #176 | Average $102,368 |
| Germans | 44.6 /100 | #177 | Average $102,254 |
| Welsh | 43.3 /100 | #178 | Average $102,151 |
| South Americans | 39.7 /100 | #179 | Fair $101,856 |
| French Canadians | 37.0 /100 | #180 | Fair $101,634 |
| Spaniards | 36.8 /100 | #181 | Fair $101,617 |
| Tsimshian | 35.9 /100 | #182 | Fair $101,543 |
| Kenyans | 34.5 /100 | #183 | Fair $101,417 |
| Immigrants | Costa Rica | 33.7 /100 | #184 | Fair $101,354 |
| Dutch | 31.9 /100 | #185 | Fair $101,192 |
Demographics Similar to Argentineans by Median Family Income
In terms of median family income, the demographic groups most similar to Argentineans are Immigrants from Western Europe ($112,688, a difference of 0.020%), Immigrants from Eastern Europe ($112,527, a difference of 0.12%), Immigrants from Italy ($112,848, a difference of 0.16%), Laotian ($112,859, a difference of 0.17%), and Immigrants from Canada ($112,374, a difference of 0.26%).
| Demographics | Rating | Rank | Median Family Income |
| Immigrants | Bulgaria | 99.6 /100 | #69 | Exceptional $113,461 |
| Immigrants | Romania | 99.6 /100 | #70 | Exceptional $113,434 |
| South Africans | 99.5 /100 | #71 | Exceptional $113,229 |
| Afghans | 99.5 /100 | #72 | Exceptional $112,971 |
| Laotians | 99.5 /100 | #73 | Exceptional $112,859 |
| Immigrants | Italy | 99.4 /100 | #74 | Exceptional $112,848 |
| Immigrants | Western Europe | 99.4 /100 | #75 | Exceptional $112,688 |
| Argentineans | 99.4 /100 | #76 | Exceptional $112,665 |
| Immigrants | Eastern Europe | 99.4 /100 | #77 | Exceptional $112,527 |
| Immigrants | Canada | 99.3 /100 | #78 | Exceptional $112,374 |
| Italians | 99.3 /100 | #79 | Exceptional $112,372 |
| Immigrants | Croatia | 99.3 /100 | #80 | Exceptional $112,323 |
| Immigrants | North America | 99.2 /100 | #81 | Exceptional $112,151 |
| Immigrants | England | 99.2 /100 | #82 | Exceptional $112,038 |
| Immigrants | Egypt | 99.0 /100 | #83 | Exceptional $111,689 |