Welsh vs Immigrants from Laos Family Households
COMPARE
Welsh
Immigrants from Laos
Family Households
Family Households Comparison
Welsh
Immigrants from Laos
64.6%
FAMILY HOUSEHOLDS
80.1/ 100
METRIC RATING
145th/ 347
METRIC RANK
65.3%
FAMILY HOUSEHOLDS
99.1/ 100
METRIC RATING
90th/ 347
METRIC RANK
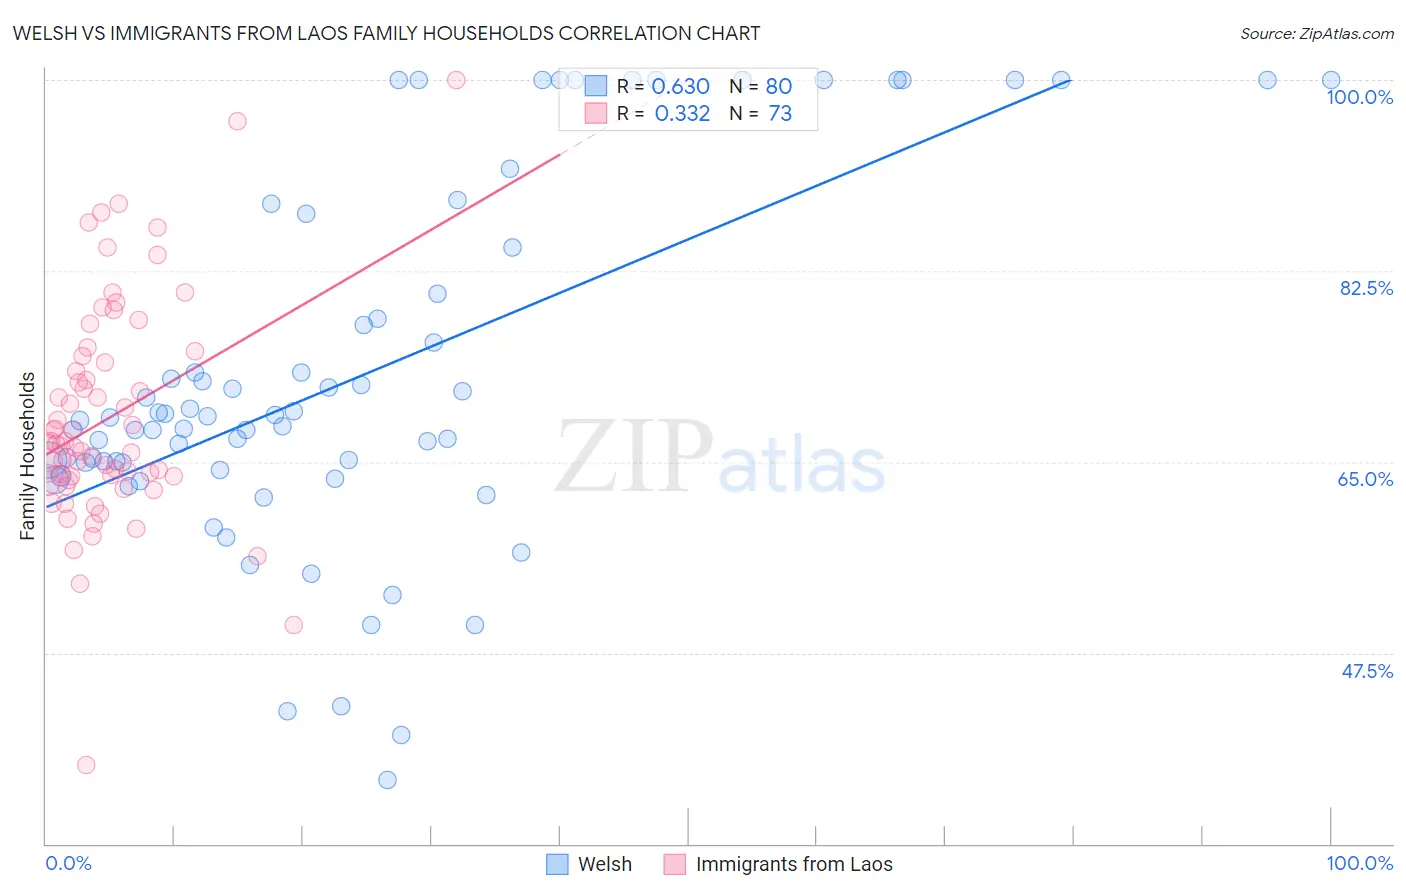
Welsh vs Immigrants from Laos Family Households Correlation Chart
The statistical analysis conducted on geographies consisting of 528,179,951 people shows a significant positive correlation between the proportion of Welsh and percentage of family households in the United States with a correlation coefficient (R) of 0.630 and weighted average of 64.6%. Similarly, the statistical analysis conducted on geographies consisting of 201,468,256 people shows a mild positive correlation between the proportion of Immigrants from Laos and percentage of family households in the United States with a correlation coefficient (R) of 0.332 and weighted average of 65.3%, a difference of 1.1%.
Family Households Correlation Summary
| Measurement | Welsh | Immigrants from Laos |
| Minimum | 35.9% | 37.2% |
| Maximum | 100.0% | 100.0% |
| Range | 64.1% | 62.8% |
| Mean | 72.8% | 69.0% |
| Median | 68.9% | 66.7% |
| Interquartile 25% (IQ1) | 64.6% | 63.5% |
| Interquartile 75% (IQ3) | 82.5% | 74.4% |
| Interquartile Range (IQR) | 17.9% | 10.9% |
| Standard Deviation (Sample) | 16.3% | 10.3% |
| Standard Deviation (Population) | 16.2% | 10.2% |
Similar Demographics by Family Households
Demographics Similar to Welsh by Family Households
In terms of family households, the demographic groups most similar to Welsh are Czechoslovakian (64.6%, a difference of 0.040%), South American Indian (64.6%, a difference of 0.040%), Immigrants from Romania (64.6%, a difference of 0.060%), Immigrants from Chile (64.6%, a difference of 0.070%), and Delaware (64.6%, a difference of 0.070%).
| Demographics | Rating | Rank | Family Households |
| Basques | 85.5 /100 | #138 | Excellent 64.7% |
| Immigrants | Jamaica | 85.3 /100 | #139 | Excellent 64.7% |
| Immigrants | North Macedonia | 84.9 /100 | #140 | Excellent 64.7% |
| Immigrants | Cameroon | 84.8 /100 | #141 | Excellent 64.7% |
| Pakistanis | 84.0 /100 | #142 | Excellent 64.7% |
| Czechoslovakians | 82.1 /100 | #143 | Excellent 64.6% |
| South American Indians | 81.9 /100 | #144 | Excellent 64.6% |
| Welsh | 80.1 /100 | #145 | Excellent 64.6% |
| Immigrants | Romania | 77.0 /100 | #146 | Good 64.6% |
| Immigrants | Chile | 76.5 /100 | #147 | Good 64.6% |
| Delaware | 76.3 /100 | #148 | Good 64.6% |
| Sioux | 76.3 /100 | #149 | Good 64.6% |
| Romanians | 75.3 /100 | #150 | Good 64.5% |
| Syrians | 75.2 /100 | #151 | Good 64.5% |
| Scottish | 70.9 /100 | #152 | Good 64.5% |
Demographics Similar to Immigrants from Laos by Family Households
In terms of family households, the demographic groups most similar to Immigrants from Laos are Immigrants from Caribbean (65.3%, a difference of 0.010%), Immigrants from Haiti (65.3%, a difference of 0.020%), Immigrants from Egypt (65.3%, a difference of 0.050%), Crow (65.3%, a difference of 0.050%), and Hopi (65.3%, a difference of 0.090%).
| Demographics | Rating | Rank | Family Households |
| Immigrants | Guyana | 99.6 /100 | #83 | Exceptional 65.5% |
| Americans | 99.6 /100 | #84 | Exceptional 65.5% |
| Immigrants | Cambodia | 99.5 /100 | #85 | Exceptional 65.4% |
| Egyptians | 99.4 /100 | #86 | Exceptional 65.4% |
| Immigrants | Egypt | 99.2 /100 | #87 | Exceptional 65.3% |
| Immigrants | Haiti | 99.1 /100 | #88 | Exceptional 65.3% |
| Immigrants | Caribbean | 99.1 /100 | #89 | Exceptional 65.3% |
| Immigrants | Laos | 99.1 /100 | #90 | Exceptional 65.3% |
| Crow | 98.9 /100 | #91 | Exceptional 65.3% |
| Hopi | 98.8 /100 | #92 | Exceptional 65.3% |
| Guyanese | 98.8 /100 | #93 | Exceptional 65.3% |
| Immigrants | Poland | 98.7 /100 | #94 | Exceptional 65.2% |
| Immigrants | Portugal | 98.6 /100 | #95 | Exceptional 65.2% |
| Swiss | 98.6 /100 | #96 | Exceptional 65.2% |
| Guatemalans | 98.6 /100 | #97 | Exceptional 65.2% |