Immigrants from Belize vs Chippewa Median Family Income
COMPARE
Immigrants from Belize
Chippewa
Median Family Income
Median Family Income Comparison
Immigrants from Belize
Chippewa
$89,197
MEDIAN FAMILY INCOME
0.1/ 100
METRIC RATING
279th/ 347
METRIC RANK
$86,852
MEDIAN FAMILY INCOME
0.0/ 100
METRIC RATING
299th/ 347
METRIC RANK
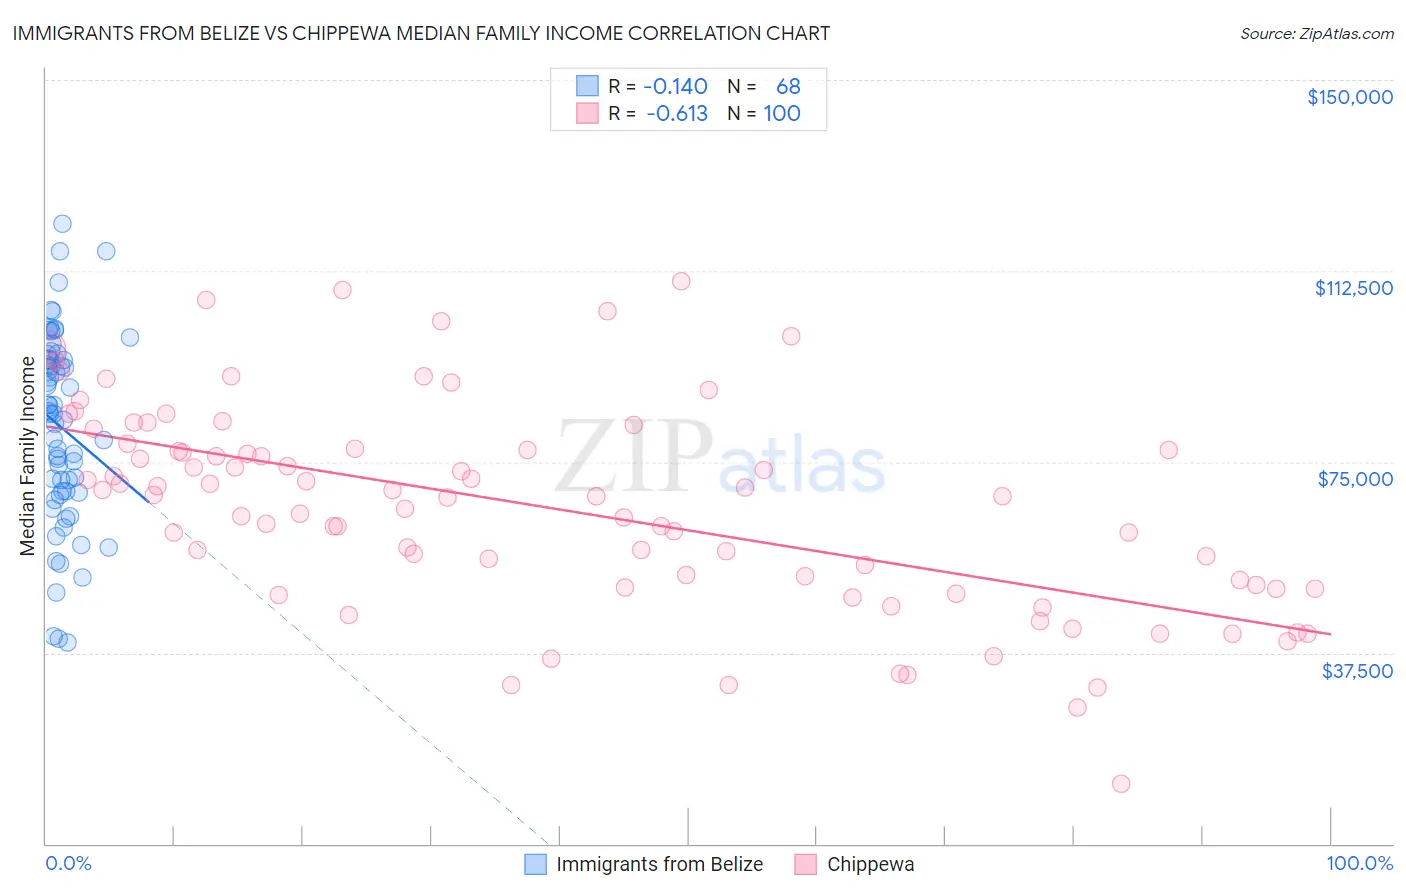
Immigrants from Belize vs Chippewa Median Family Income Correlation Chart
The statistical analysis conducted on geographies consisting of 130,266,359 people shows a poor negative correlation between the proportion of Immigrants from Belize and median family income in the United States with a correlation coefficient (R) of -0.140 and weighted average of $89,197. Similarly, the statistical analysis conducted on geographies consisting of 214,970,726 people shows a significant negative correlation between the proportion of Chippewa and median family income in the United States with a correlation coefficient (R) of -0.613 and weighted average of $86,852, a difference of 2.7%.
Median Family Income Correlation Summary
| Measurement | Immigrants from Belize | Chippewa |
| Minimum | $39,621 | $11,667 |
| Maximum | $121,707 | $110,455 |
| Range | $82,086 | $98,788 |
| Mean | $81,787 | $65,965 |
| Median | $84,449 | $68,273 |
| Interquartile 25% (IQ1) | $69,088 | $50,598 |
| Interquartile 75% (IQ3) | $95,112 | $77,379 |
| Interquartile Range (IQR) | $26,023 | $26,781 |
| Standard Deviation (Sample) | $18,723 | $20,173 |
| Standard Deviation (Population) | $18,585 | $20,072 |
Demographics Similar to Immigrants from Belize and Chippewa by Median Family Income
In terms of median family income, the demographic groups most similar to Immigrants from Belize are British West Indian ($88,987, a difference of 0.24%), Blackfeet ($88,717, a difference of 0.54%), Comanche ($88,556, a difference of 0.72%), Bangladeshi ($88,358, a difference of 0.95%), and Indonesian ($88,301, a difference of 1.0%). Similarly, the demographic groups most similar to Chippewa are Immigrants from Latin America ($86,989, a difference of 0.16%), Cajun ($87,157, a difference of 0.35%), Immigrants from Guatemala ($87,191, a difference of 0.39%), Yaqui ($87,289, a difference of 0.50%), and Fijian ($87,387, a difference of 0.62%).
| Demographics | Rating | Rank | Median Family Income |
| Immigrants | Belize | 0.1 /100 | #279 | Tragic $89,197 |
| British West Indians | 0.1 /100 | #280 | Tragic $88,987 |
| Blackfeet | 0.1 /100 | #281 | Tragic $88,717 |
| Comanche | 0.1 /100 | #282 | Tragic $88,556 |
| Bangladeshis | 0.1 /100 | #283 | Tragic $88,358 |
| Indonesians | 0.1 /100 | #284 | Tragic $88,301 |
| Guatemalans | 0.1 /100 | #285 | Tragic $88,295 |
| Immigrants | Nicaragua | 0.1 /100 | #286 | Tragic $88,267 |
| Potawatomi | 0.1 /100 | #287 | Tragic $88,265 |
| Cherokee | 0.1 /100 | #288 | Tragic $88,209 |
| Central American Indians | 0.1 /100 | #289 | Tragic $88,034 |
| Shoshone | 0.1 /100 | #290 | Tragic $87,872 |
| Immigrants | Cabo Verde | 0.1 /100 | #291 | Tragic $87,830 |
| Africans | 0.1 /100 | #292 | Tragic $87,820 |
| Ute | 0.0 /100 | #293 | Tragic $87,596 |
| Fijians | 0.0 /100 | #294 | Tragic $87,387 |
| Yaqui | 0.0 /100 | #295 | Tragic $87,289 |
| Immigrants | Guatemala | 0.0 /100 | #296 | Tragic $87,191 |
| Cajuns | 0.0 /100 | #297 | Tragic $87,157 |
| Immigrants | Latin America | 0.0 /100 | #298 | Tragic $86,989 |
| Chippewa | 0.0 /100 | #299 | Tragic $86,852 |