Vietnamese vs Immigrants from Nigeria Per Capita Income
COMPARE
Vietnamese
Immigrants from Nigeria
Per Capita Income
Per Capita Income Comparison
Vietnamese
Immigrants from Nigeria
$42,368
PER CAPITA INCOME
19.0/ 100
METRIC RATING
200th/ 347
METRIC RANK
$40,339
PER CAPITA INCOME
2.3/ 100
METRIC RATING
240th/ 347
METRIC RANK
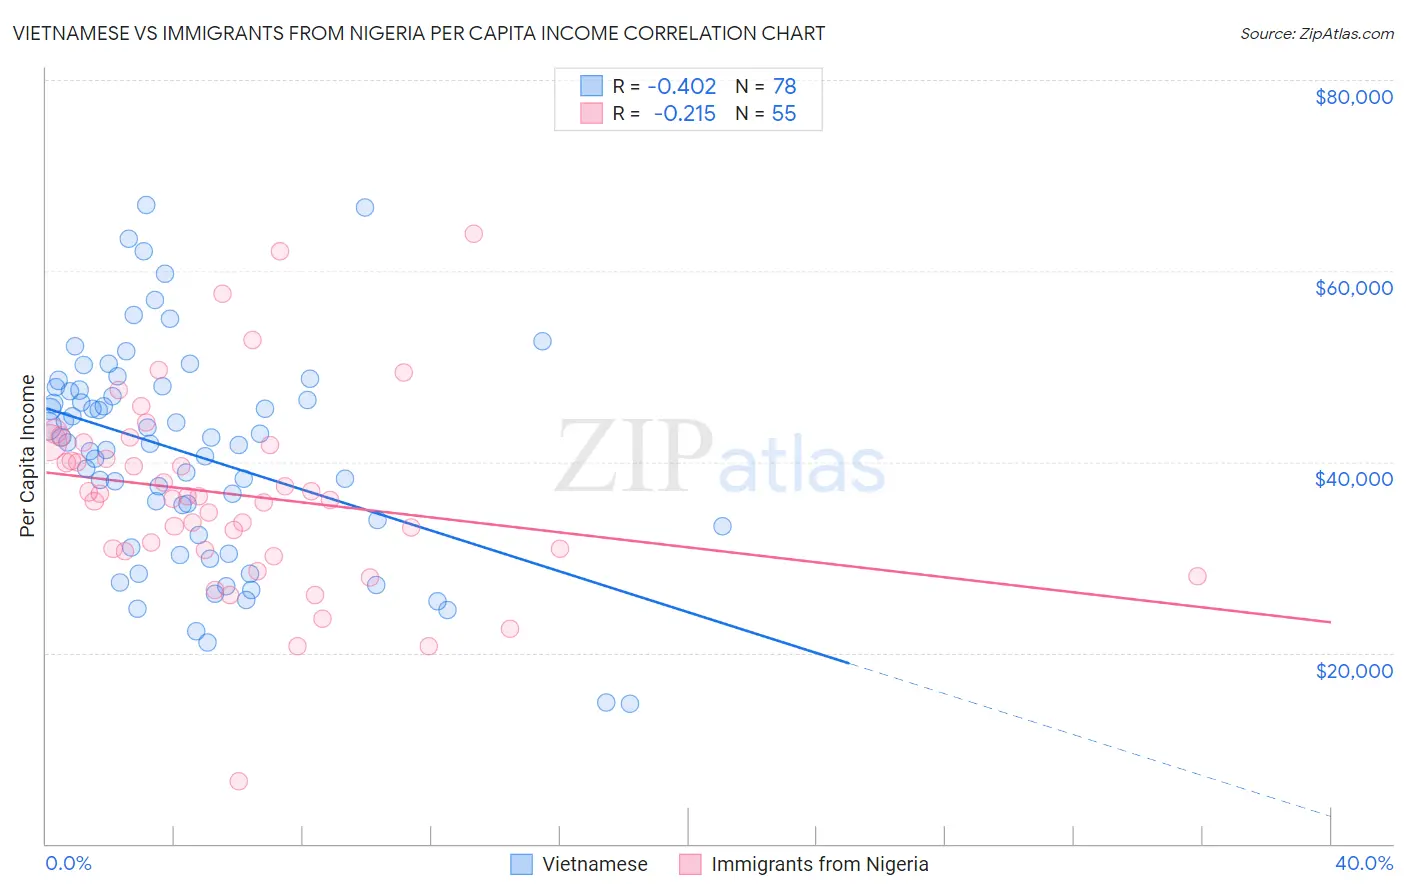
Vietnamese vs Immigrants from Nigeria Per Capita Income Correlation Chart
The statistical analysis conducted on geographies consisting of 170,759,165 people shows a moderate negative correlation between the proportion of Vietnamese and per capita income in the United States with a correlation coefficient (R) of -0.402 and weighted average of $42,368. Similarly, the statistical analysis conducted on geographies consisting of 283,501,932 people shows a weak negative correlation between the proportion of Immigrants from Nigeria and per capita income in the United States with a correlation coefficient (R) of -0.215 and weighted average of $40,339, a difference of 5.0%.
Per Capita Income Correlation Summary
| Measurement | Vietnamese | Immigrants from Nigeria |
| Minimum | $14,629 | $6,524 |
| Maximum | $66,907 | $63,917 |
| Range | $52,278 | $57,393 |
| Mean | $40,731 | $36,581 |
| Median | $41,985 | $36,394 |
| Interquartile 25% (IQ1) | $32,361 | $30,744 |
| Interquartile 75% (IQ3) | $47,484 | $42,001 |
| Interquartile Range (IQR) | $15,123 | $11,256 |
| Standard Deviation (Sample) | $11,295 | $10,124 |
| Standard Deviation (Population) | $11,222 | $10,032 |
Similar Demographics by Per Capita Income
Demographics Similar to Vietnamese by Per Capita Income
In terms of per capita income, the demographic groups most similar to Vietnamese are Barbadian ($42,406, a difference of 0.090%), Immigrants from Portugal ($42,412, a difference of 0.10%), Immigrants from Thailand ($42,289, a difference of 0.19%), Immigrants from Bosnia and Herzegovina ($42,278, a difference of 0.21%), and Spanish ($42,249, a difference of 0.28%).
| Demographics | Rating | Rank | Per Capita Income |
| Immigrants | Sierra Leone | 26.5 /100 | #193 | Fair $42,752 |
| Immigrants | Fiji | 25.2 /100 | #194 | Fair $42,694 |
| Immigrants | Kenya | 24.5 /100 | #195 | Fair $42,661 |
| Dutch | 23.4 /100 | #196 | Fair $42,605 |
| Scotch-Irish | 22.6 /100 | #197 | Fair $42,563 |
| Immigrants | Portugal | 19.7 /100 | #198 | Poor $42,412 |
| Barbadians | 19.6 /100 | #199 | Poor $42,406 |
| Vietnamese | 19.0 /100 | #200 | Poor $42,368 |
| Immigrants | Thailand | 17.6 /100 | #201 | Poor $42,289 |
| Immigrants | Bosnia and Herzegovina | 17.5 /100 | #202 | Poor $42,278 |
| Spanish | 17.0 /100 | #203 | Poor $42,249 |
| Aleuts | 16.4 /100 | #204 | Poor $42,210 |
| Whites/Caucasians | 15.9 /100 | #205 | Poor $42,180 |
| Ghanaians | 15.7 /100 | #206 | Poor $42,164 |
| Venezuelans | 14.4 /100 | #207 | Poor $42,074 |
Demographics Similar to Immigrants from Nigeria by Per Capita Income
In terms of per capita income, the demographic groups most similar to Immigrants from Nigeria are Tsimshian ($40,344, a difference of 0.010%), British West Indian ($40,330, a difference of 0.020%), Somali ($40,367, a difference of 0.070%), Immigrants from Western Africa ($40,294, a difference of 0.11%), and German Russian ($40,266, a difference of 0.18%).
| Demographics | Rating | Rank | Per Capita Income |
| Delaware | 3.8 /100 | #233 | Tragic $40,778 |
| Immigrants | West Indies | 3.7 /100 | #234 | Tragic $40,763 |
| Immigrants | Guyana | 3.6 /100 | #235 | Tragic $40,742 |
| Immigrants | Nonimmigrants | 3.4 /100 | #236 | Tragic $40,669 |
| Immigrants | Cambodia | 2.6 /100 | #237 | Tragic $40,434 |
| Somalis | 2.4 /100 | #238 | Tragic $40,367 |
| Tsimshian | 2.4 /100 | #239 | Tragic $40,344 |
| Immigrants | Nigeria | 2.3 /100 | #240 | Tragic $40,339 |
| British West Indians | 2.3 /100 | #241 | Tragic $40,330 |
| Immigrants | Western Africa | 2.2 /100 | #242 | Tragic $40,294 |
| German Russians | 2.2 /100 | #243 | Tragic $40,266 |
| French American Indians | 2.1 /100 | #244 | Tragic $40,244 |
| Sub-Saharan Africans | 1.9 /100 | #245 | Tragic $40,152 |
| Cree | 1.7 /100 | #246 | Tragic $40,056 |
| Immigrants | Somalia | 1.6 /100 | #247 | Tragic $39,974 |