Vietnamese vs Yakama Per Capita Income
COMPARE
Vietnamese
Yakama
Per Capita Income
Per Capita Income Comparison
Vietnamese
Yakama
$42,368
PER CAPITA INCOME
19.0/ 100
METRIC RATING
200th/ 347
METRIC RANK
$33,009
PER CAPITA INCOME
0.0/ 100
METRIC RATING
336th/ 347
METRIC RANK
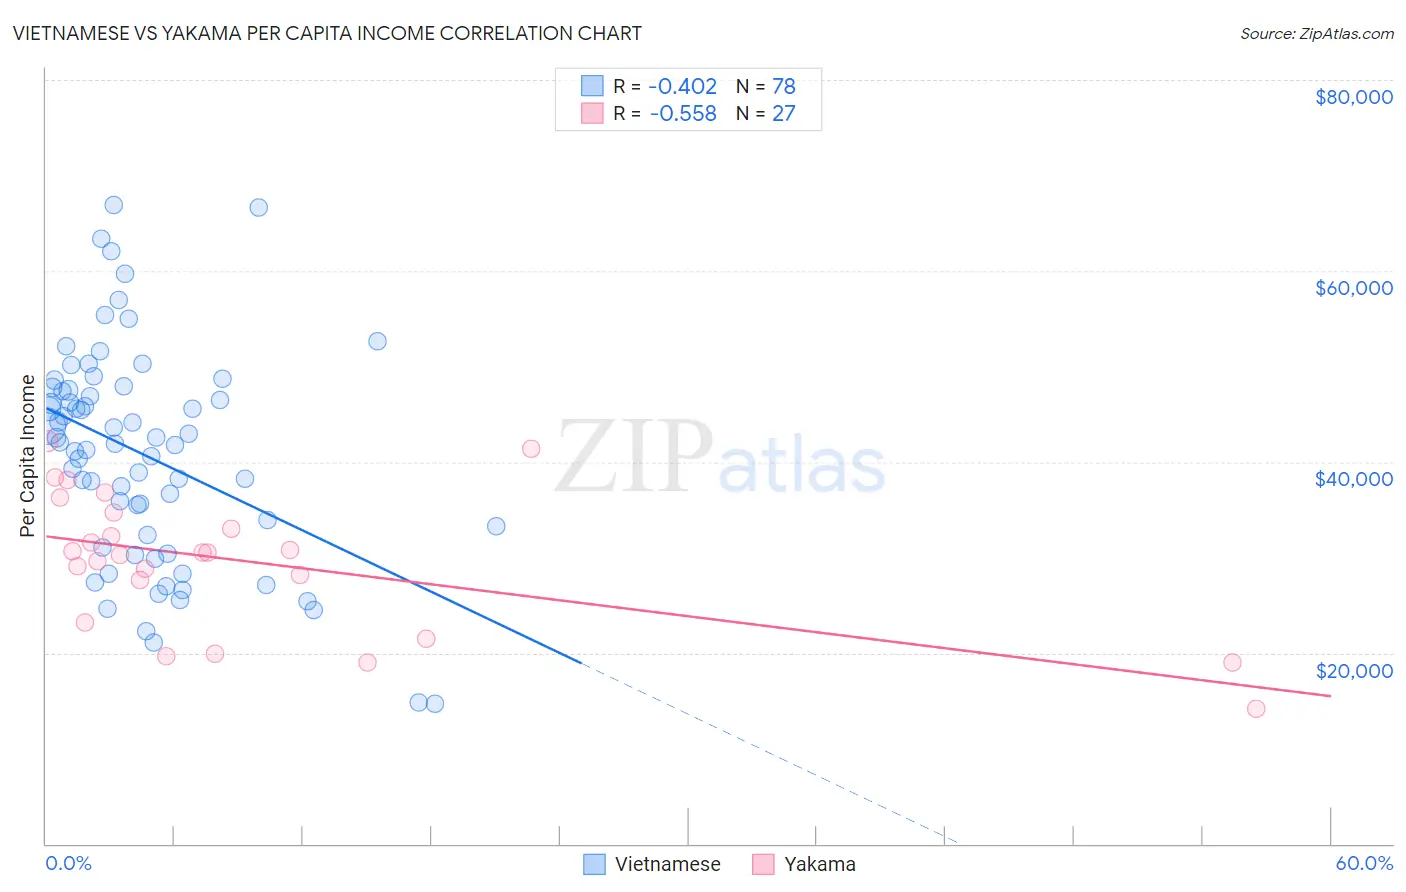
Vietnamese vs Yakama Per Capita Income Correlation Chart
The statistical analysis conducted on geographies consisting of 170,759,165 people shows a moderate negative correlation between the proportion of Vietnamese and per capita income in the United States with a correlation coefficient (R) of -0.402 and weighted average of $42,368. Similarly, the statistical analysis conducted on geographies consisting of 19,923,144 people shows a substantial negative correlation between the proportion of Yakama and per capita income in the United States with a correlation coefficient (R) of -0.558 and weighted average of $33,009, a difference of 28.3%.
Per Capita Income Correlation Summary
| Measurement | Vietnamese | Yakama |
| Minimum | $14,629 | $14,175 |
| Maximum | $66,907 | $42,131 |
| Range | $52,278 | $27,956 |
| Mean | $40,731 | $29,512 |
| Median | $41,985 | $30,514 |
| Interquartile 25% (IQ1) | $32,361 | $23,165 |
| Interquartile 75% (IQ3) | $47,484 | $34,761 |
| Interquartile Range (IQR) | $15,123 | $11,597 |
| Standard Deviation (Sample) | $11,295 | $7,251 |
| Standard Deviation (Population) | $11,222 | $7,116 |
Similar Demographics by Per Capita Income
Demographics Similar to Vietnamese by Per Capita Income
In terms of per capita income, the demographic groups most similar to Vietnamese are Barbadian ($42,406, a difference of 0.090%), Immigrants from Portugal ($42,412, a difference of 0.10%), Immigrants from Thailand ($42,289, a difference of 0.19%), Immigrants from Bosnia and Herzegovina ($42,278, a difference of 0.21%), and Spanish ($42,249, a difference of 0.28%).
| Demographics | Rating | Rank | Per Capita Income |
| Immigrants | Sierra Leone | 26.5 /100 | #193 | Fair $42,752 |
| Immigrants | Fiji | 25.2 /100 | #194 | Fair $42,694 |
| Immigrants | Kenya | 24.5 /100 | #195 | Fair $42,661 |
| Dutch | 23.4 /100 | #196 | Fair $42,605 |
| Scotch-Irish | 22.6 /100 | #197 | Fair $42,563 |
| Immigrants | Portugal | 19.7 /100 | #198 | Poor $42,412 |
| Barbadians | 19.6 /100 | #199 | Poor $42,406 |
| Vietnamese | 19.0 /100 | #200 | Poor $42,368 |
| Immigrants | Thailand | 17.6 /100 | #201 | Poor $42,289 |
| Immigrants | Bosnia and Herzegovina | 17.5 /100 | #202 | Poor $42,278 |
| Spanish | 17.0 /100 | #203 | Poor $42,249 |
| Aleuts | 16.4 /100 | #204 | Poor $42,210 |
| Whites/Caucasians | 15.9 /100 | #205 | Poor $42,180 |
| Ghanaians | 15.7 /100 | #206 | Poor $42,164 |
| Venezuelans | 14.4 /100 | #207 | Poor $42,074 |
Demographics Similar to Yakama by Per Capita Income
In terms of per capita income, the demographic groups most similar to Yakama are Houma ($32,996, a difference of 0.040%), Yuman ($33,236, a difference of 0.69%), Native/Alaskan ($33,279, a difference of 0.82%), Arapaho ($32,345, a difference of 2.1%), and Immigrants from Yemen ($33,696, a difference of 2.1%).
| Demographics | Rating | Rank | Per Capita Income |
| Mexicans | 0.0 /100 | #329 | Tragic $34,559 |
| Spanish American Indians | 0.0 /100 | #330 | Tragic $34,195 |
| Immigrants | Mexico | 0.0 /100 | #331 | Tragic $33,931 |
| Sioux | 0.0 /100 | #332 | Tragic $33,921 |
| Immigrants | Yemen | 0.0 /100 | #333 | Tragic $33,696 |
| Natives/Alaskans | 0.0 /100 | #334 | Tragic $33,279 |
| Yuman | 0.0 /100 | #335 | Tragic $33,236 |
| Yakama | 0.0 /100 | #336 | Tragic $33,009 |
| Houma | 0.0 /100 | #337 | Tragic $32,996 |
| Arapaho | 0.0 /100 | #338 | Tragic $32,345 |
| Pueblo | 0.0 /100 | #339 | Tragic $32,012 |
| Crow | 0.0 /100 | #340 | Tragic $31,729 |
| Puerto Ricans | 0.0 /100 | #341 | Tragic $31,268 |
| Hopi | 0.0 /100 | #342 | Tragic $31,177 |
| Pima | 0.0 /100 | #343 | Tragic $30,644 |