Vietnamese vs Afghan Per Capita Income
COMPARE
Vietnamese
Afghan
Per Capita Income
Per Capita Income Comparison
Vietnamese
Afghans
$42,368
PER CAPITA INCOME
19.0/ 100
METRIC RATING
200th/ 347
METRIC RANK
$46,268
PER CAPITA INCOME
94.9/ 100
METRIC RATING
114th/ 347
METRIC RANK
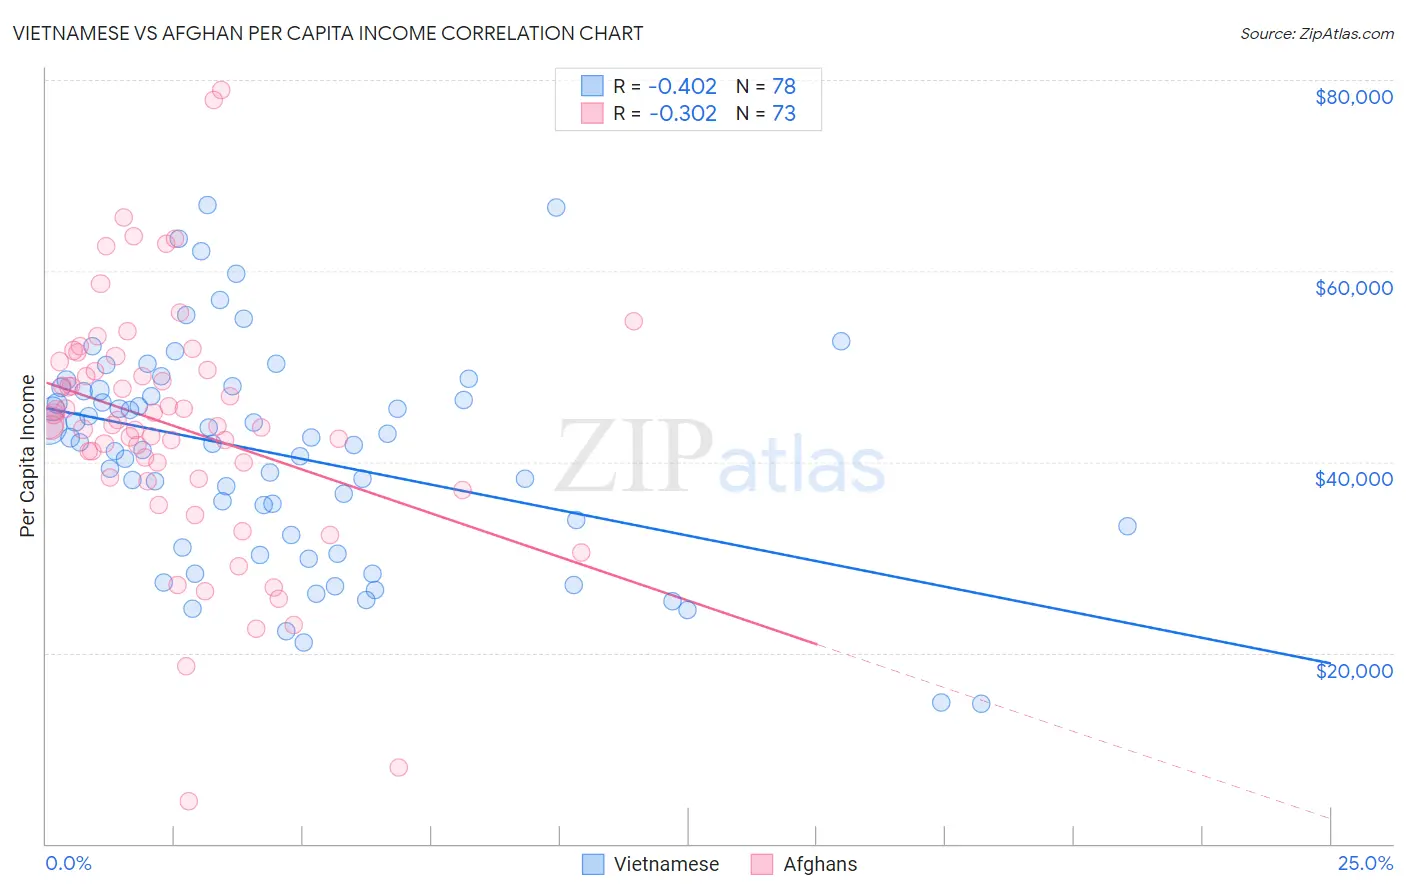
Vietnamese vs Afghan Per Capita Income Correlation Chart
The statistical analysis conducted on geographies consisting of 170,759,165 people shows a moderate negative correlation between the proportion of Vietnamese and per capita income in the United States with a correlation coefficient (R) of -0.402 and weighted average of $42,368. Similarly, the statistical analysis conducted on geographies consisting of 148,874,934 people shows a mild negative correlation between the proportion of Afghans and per capita income in the United States with a correlation coefficient (R) of -0.302 and weighted average of $46,268, a difference of 9.2%.
Per Capita Income Correlation Summary
| Measurement | Vietnamese | Afghan |
| Minimum | $14,629 | $4,471 |
| Maximum | $66,907 | $78,942 |
| Range | $52,278 | $74,471 |
| Mean | $40,731 | $43,744 |
| Median | $41,985 | $43,810 |
| Interquartile 25% (IQ1) | $32,361 | $38,293 |
| Interquartile 75% (IQ3) | $47,484 | $50,059 |
| Interquartile Range (IQR) | $15,123 | $11,766 |
| Standard Deviation (Sample) | $11,295 | $13,009 |
| Standard Deviation (Population) | $11,222 | $12,919 |
Similar Demographics by Per Capita Income
Demographics Similar to Vietnamese by Per Capita Income
In terms of per capita income, the demographic groups most similar to Vietnamese are Barbadian ($42,406, a difference of 0.090%), Immigrants from Portugal ($42,412, a difference of 0.10%), Immigrants from Thailand ($42,289, a difference of 0.19%), Immigrants from Bosnia and Herzegovina ($42,278, a difference of 0.21%), and Spanish ($42,249, a difference of 0.28%).
| Demographics | Rating | Rank | Per Capita Income |
| Immigrants | Sierra Leone | 26.5 /100 | #193 | Fair $42,752 |
| Immigrants | Fiji | 25.2 /100 | #194 | Fair $42,694 |
| Immigrants | Kenya | 24.5 /100 | #195 | Fair $42,661 |
| Dutch | 23.4 /100 | #196 | Fair $42,605 |
| Scotch-Irish | 22.6 /100 | #197 | Fair $42,563 |
| Immigrants | Portugal | 19.7 /100 | #198 | Poor $42,412 |
| Barbadians | 19.6 /100 | #199 | Poor $42,406 |
| Vietnamese | 19.0 /100 | #200 | Poor $42,368 |
| Immigrants | Thailand | 17.6 /100 | #201 | Poor $42,289 |
| Immigrants | Bosnia and Herzegovina | 17.5 /100 | #202 | Poor $42,278 |
| Spanish | 17.0 /100 | #203 | Poor $42,249 |
| Aleuts | 16.4 /100 | #204 | Poor $42,210 |
| Whites/Caucasians | 15.9 /100 | #205 | Poor $42,180 |
| Ghanaians | 15.7 /100 | #206 | Poor $42,164 |
| Venezuelans | 14.4 /100 | #207 | Poor $42,074 |
Demographics Similar to Afghans by Per Capita Income
In terms of per capita income, the demographic groups most similar to Afghans are Immigrants from Chile ($46,213, a difference of 0.12%), Immigrants from Albania ($46,387, a difference of 0.26%), Polish ($46,123, a difference of 0.32%), Immigrants from Morocco ($46,430, a difference of 0.35%), and Chinese ($46,098, a difference of 0.37%).
| Demographics | Rating | Rank | Per Capita Income |
| Serbians | 96.2 /100 | #107 | Exceptional $46,551 |
| Immigrants | Kuwait | 96.2 /100 | #108 | Exceptional $46,543 |
| Immigrants | Northern Africa | 96.2 /100 | #109 | Exceptional $46,531 |
| Chileans | 95.9 /100 | #110 | Exceptional $46,459 |
| Taiwanese | 95.8 /100 | #111 | Exceptional $46,455 |
| Immigrants | Morocco | 95.7 /100 | #112 | Exceptional $46,430 |
| Immigrants | Albania | 95.5 /100 | #113 | Exceptional $46,387 |
| Afghans | 94.9 /100 | #114 | Exceptional $46,268 |
| Immigrants | Chile | 94.6 /100 | #115 | Exceptional $46,213 |
| Poles | 94.1 /100 | #116 | Exceptional $46,123 |
| Chinese | 93.9 /100 | #117 | Exceptional $46,098 |
| Immigrants | Saudi Arabia | 93.3 /100 | #118 | Exceptional $46,008 |
| Immigrants | Poland | 93.1 /100 | #119 | Exceptional $45,979 |
| Immigrants | Ethiopia | 92.7 /100 | #120 | Exceptional $45,923 |
| Canadians | 92.2 /100 | #121 | Exceptional $45,858 |