Vietnamese vs Immigrants from Nigeria Hearing Disability
COMPARE
Vietnamese
Immigrants from Nigeria
Hearing Disability
Hearing Disability Comparison
Vietnamese
Immigrants from Nigeria
2.4%
HEARING DISABILITY
100.0/ 100
METRIC RATING
6th/ 347
METRIC RANK
2.6%
HEARING DISABILITY
99.8/ 100
METRIC RATING
23rd/ 347
METRIC RANK
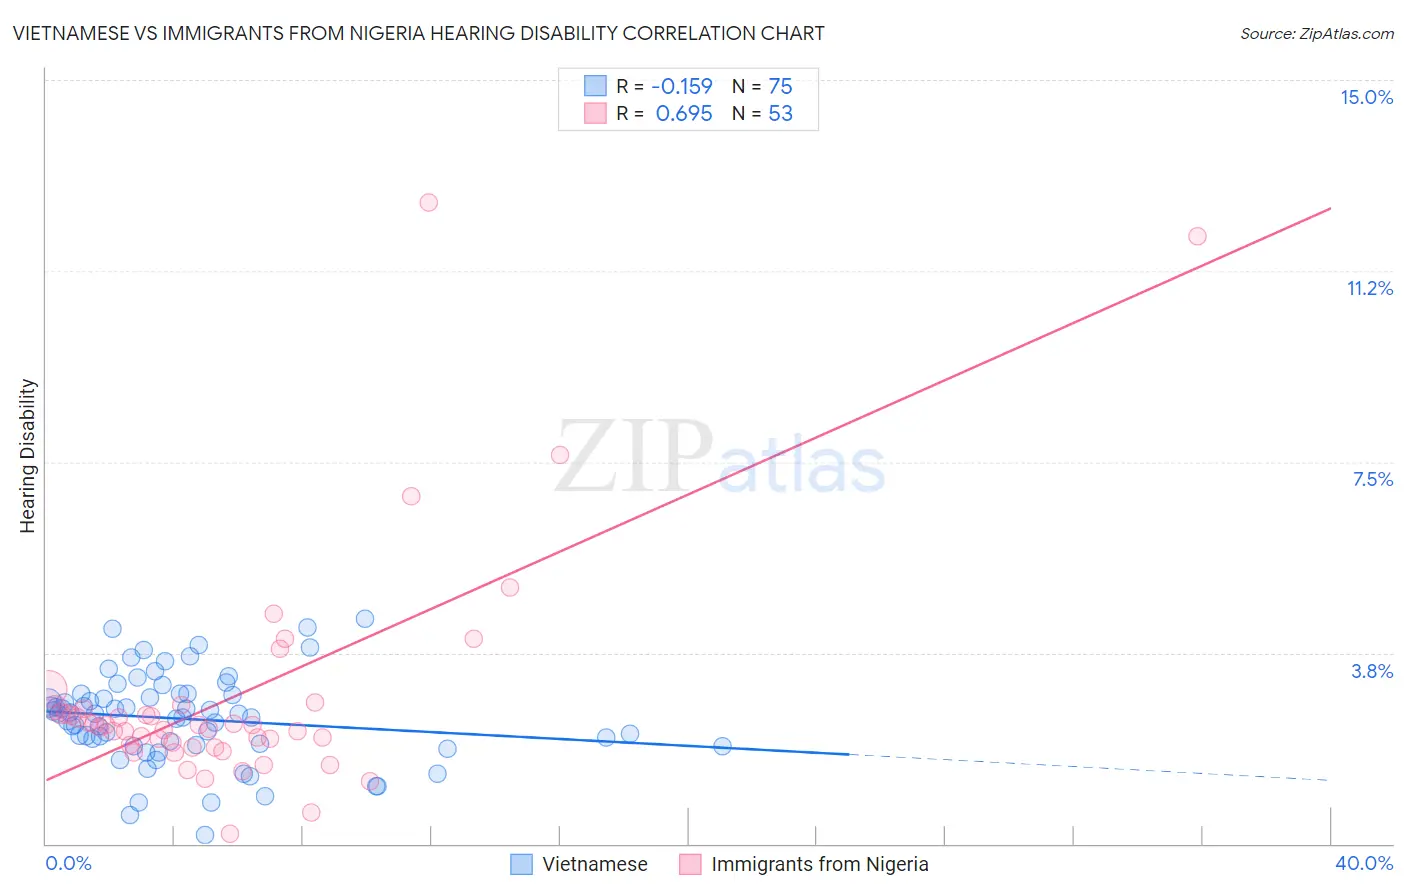
Vietnamese vs Immigrants from Nigeria Hearing Disability Correlation Chart
The statistical analysis conducted on geographies consisting of 170,714,585 people shows a poor negative correlation between the proportion of Vietnamese and percentage of population with hearing disability in the United States with a correlation coefficient (R) of -0.159 and weighted average of 2.4%. Similarly, the statistical analysis conducted on geographies consisting of 283,406,904 people shows a significant positive correlation between the proportion of Immigrants from Nigeria and percentage of population with hearing disability in the United States with a correlation coefficient (R) of 0.695 and weighted average of 2.6%, a difference of 7.4%.
Hearing Disability Correlation Summary
| Measurement | Vietnamese | Immigrants from Nigeria |
| Minimum | 0.18% | 0.19% |
| Maximum | 4.4% | 12.6% |
| Range | 4.2% | 12.4% |
| Mean | 2.5% | 2.9% |
| Median | 2.6% | 2.3% |
| Interquartile 25% (IQ1) | 1.9% | 1.9% |
| Interquartile 75% (IQ3) | 2.9% | 2.7% |
| Interquartile Range (IQR) | 0.99% | 0.75% |
| Standard Deviation (Sample) | 0.87% | 2.3% |
| Standard Deviation (Population) | 0.87% | 2.2% |
Demographics Similar to Vietnamese and Immigrants from Nigeria by Hearing Disability
In terms of hearing disability, the demographic groups most similar to Vietnamese are Immigrants from Barbados (2.4%, a difference of 1.1%), Immigrants from Bangladesh (2.4%, a difference of 1.6%), British West Indian (2.4%, a difference of 1.8%), Immigrants from Dominican Republic (2.4%, a difference of 2.6%), and Immigrants from Guyana (2.3%, a difference of 3.0%). Similarly, the demographic groups most similar to Immigrants from Nigeria are Immigrants from Ghana (2.6%, a difference of 0.25%), Immigrants from Sierra Leone (2.6%, a difference of 0.50%), Ghanaian (2.5%, a difference of 0.54%), Immigrants from Bolivia (2.5%, a difference of 0.61%), and Thai (2.5%, a difference of 0.65%).
| Demographics | Rating | Rank | Hearing Disability |
| Immigrants | Guyana | 100.0 /100 | #4 | Exceptional 2.3% |
| Immigrants | Barbados | 100.0 /100 | #5 | Exceptional 2.4% |
| Vietnamese | 100.0 /100 | #6 | Exceptional 2.4% |
| Immigrants | Bangladesh | 100.0 /100 | #7 | Exceptional 2.4% |
| British West Indians | 100.0 /100 | #8 | Exceptional 2.4% |
| Immigrants | Dominican Republic | 100.0 /100 | #9 | Exceptional 2.4% |
| Immigrants | Ecuador | 99.9 /100 | #10 | Exceptional 2.5% |
| Immigrants | Trinidad and Tobago | 99.9 /100 | #11 | Exceptional 2.5% |
| Trinidadians and Tobagonians | 99.9 /100 | #12 | Exceptional 2.5% |
| Sierra Leoneans | 99.9 /100 | #13 | Exceptional 2.5% |
| Ecuadorians | 99.9 /100 | #14 | Exceptional 2.5% |
| Barbadians | 99.9 /100 | #15 | Exceptional 2.5% |
| Immigrants | West Indies | 99.9 /100 | #16 | Exceptional 2.5% |
| Immigrants | India | 99.9 /100 | #17 | Exceptional 2.5% |
| Dominicans | 99.8 /100 | #18 | Exceptional 2.5% |
| Thais | 99.8 /100 | #19 | Exceptional 2.5% |
| Immigrants | Bolivia | 99.8 /100 | #20 | Exceptional 2.5% |
| Ghanaians | 99.8 /100 | #21 | Exceptional 2.5% |
| Immigrants | Sierra Leone | 99.8 /100 | #22 | Exceptional 2.6% |
| Immigrants | Nigeria | 99.8 /100 | #23 | Exceptional 2.6% |
| Immigrants | Ghana | 99.8 /100 | #24 | Exceptional 2.6% |