Immigrants from Barbados vs Immigrants from Nigeria Per Capita Income
COMPARE
Immigrants from Barbados
Immigrants from Nigeria
Per Capita Income
Per Capita Income Comparison
Immigrants from Barbados
Immigrants from Nigeria
$41,478
PER CAPITA INCOME
7.9/ 100
METRIC RATING
220th/ 347
METRIC RANK
$40,339
PER CAPITA INCOME
2.3/ 100
METRIC RATING
240th/ 347
METRIC RANK
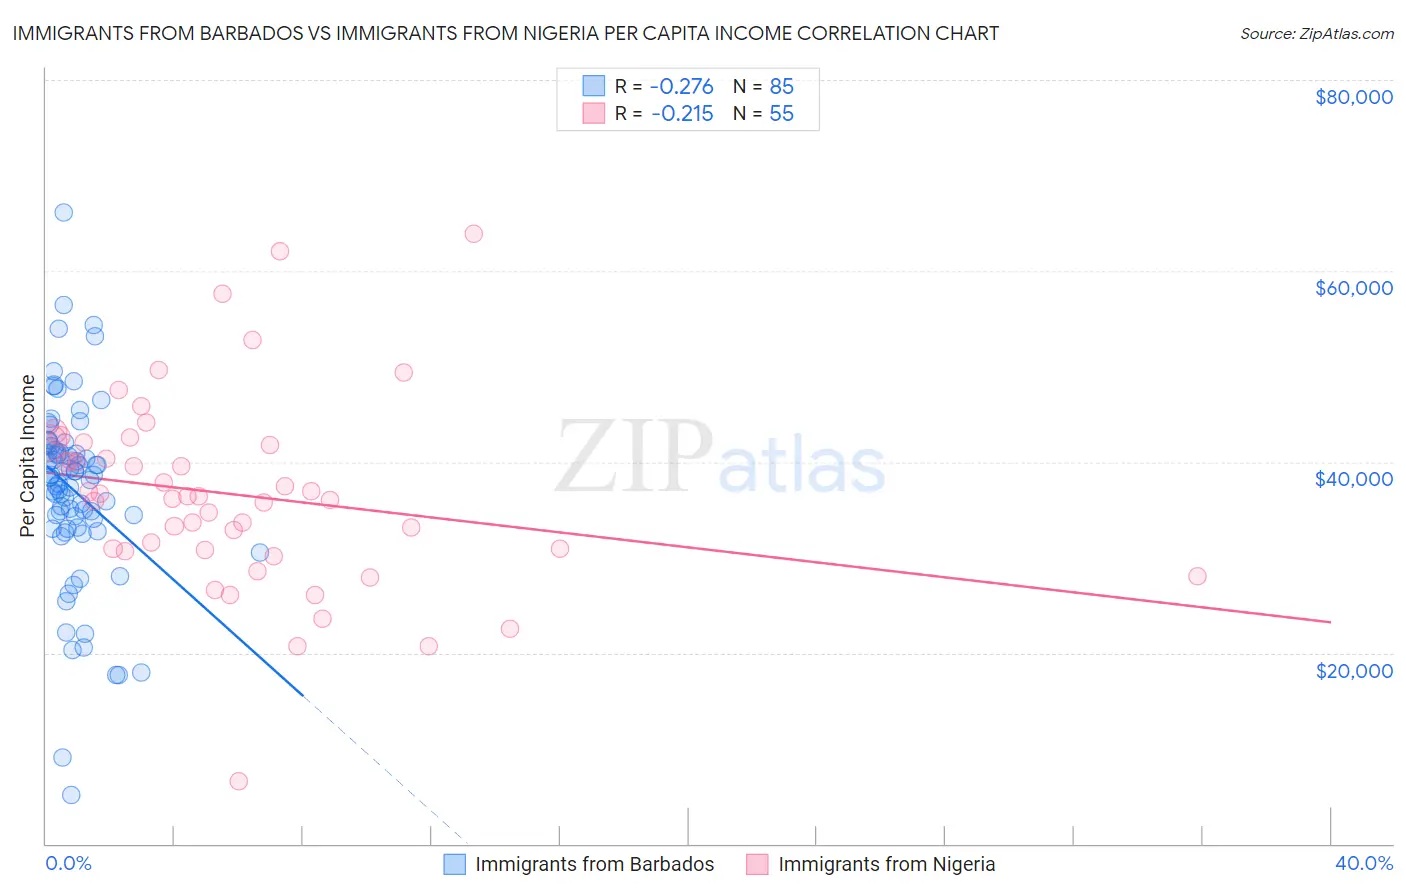
Immigrants from Barbados vs Immigrants from Nigeria Per Capita Income Correlation Chart
The statistical analysis conducted on geographies consisting of 112,709,172 people shows a weak negative correlation between the proportion of Immigrants from Barbados and per capita income in the United States with a correlation coefficient (R) of -0.276 and weighted average of $41,478. Similarly, the statistical analysis conducted on geographies consisting of 283,501,932 people shows a weak negative correlation between the proportion of Immigrants from Nigeria and per capita income in the United States with a correlation coefficient (R) of -0.215 and weighted average of $40,339, a difference of 2.8%.
Per Capita Income Correlation Summary
| Measurement | Immigrants from Barbados | Immigrants from Nigeria |
| Minimum | $5,075 | $6,524 |
| Maximum | $66,187 | $63,917 |
| Range | $61,112 | $57,393 |
| Mean | $37,004 | $36,581 |
| Median | $38,335 | $36,394 |
| Interquartile 25% (IQ1) | $33,039 | $30,744 |
| Interquartile 75% (IQ3) | $41,445 | $42,001 |
| Interquartile Range (IQR) | $8,406 | $11,256 |
| Standard Deviation (Sample) | $9,798 | $10,124 |
| Standard Deviation (Population) | $9,740 | $10,032 |
Demographics Similar to Immigrants from Barbados and Immigrants from Nigeria by Per Capita Income
In terms of per capita income, the demographic groups most similar to Immigrants from Barbados are Immigrants from Trinidad and Tobago ($41,476, a difference of 0.0%), Immigrants from Iraq ($41,365, a difference of 0.27%), Immigrants from Cameroon ($41,334, a difference of 0.35%), Immigrants from St. Vincent and the Grenadines ($41,270, a difference of 0.50%), and West Indian ($41,217, a difference of 0.63%). Similarly, the demographic groups most similar to Immigrants from Nigeria are Tsimshian ($40,344, a difference of 0.010%), Somali ($40,367, a difference of 0.070%), Immigrants from Cambodia ($40,434, a difference of 0.24%), Nonimmigrants ($40,669, a difference of 0.82%), and Immigrants from Guyana ($40,742, a difference of 1.0%).
| Demographics | Rating | Rank | Per Capita Income |
| Immigrants | Barbados | 7.9 /100 | #220 | Tragic $41,478 |
| Immigrants | Trinidad and Tobago | 7.9 /100 | #221 | Tragic $41,476 |
| Immigrants | Iraq | 7.1 /100 | #222 | Tragic $41,365 |
| Immigrants | Cameroon | 6.8 /100 | #223 | Tragic $41,334 |
| Immigrants | St. Vincent and the Grenadines | 6.4 /100 | #224 | Tragic $41,270 |
| West Indians | 6.0 /100 | #225 | Tragic $41,217 |
| Immigrants | Ecuador | 5.9 /100 | #226 | Tragic $41,195 |
| Immigrants | Ghana | 5.5 /100 | #227 | Tragic $41,131 |
| Immigrants | Grenada | 5.5 /100 | #228 | Tragic $41,123 |
| Nigerians | 4.9 /100 | #229 | Tragic $41,026 |
| Native Hawaiians | 4.9 /100 | #230 | Tragic $41,017 |
| Senegalese | 4.8 /100 | #231 | Tragic $41,000 |
| Guyanese | 4.5 /100 | #232 | Tragic $40,949 |
| Delaware | 3.8 /100 | #233 | Tragic $40,778 |
| Immigrants | West Indies | 3.7 /100 | #234 | Tragic $40,763 |
| Immigrants | Guyana | 3.6 /100 | #235 | Tragic $40,742 |
| Immigrants | Nonimmigrants | 3.4 /100 | #236 | Tragic $40,669 |
| Immigrants | Cambodia | 2.6 /100 | #237 | Tragic $40,434 |
| Somalis | 2.4 /100 | #238 | Tragic $40,367 |
| Tsimshian | 2.4 /100 | #239 | Tragic $40,344 |
| Immigrants | Nigeria | 2.3 /100 | #240 | Tragic $40,339 |