Liberian vs Immigrants from Nigeria Per Capita Income
COMPARE
Liberian
Immigrants from Nigeria
Per Capita Income
Per Capita Income Comparison
Liberians
Immigrants from Nigeria
$38,780
PER CAPITA INCOME
0.4/ 100
METRIC RATING
268th/ 347
METRIC RANK
$40,339
PER CAPITA INCOME
2.3/ 100
METRIC RATING
240th/ 347
METRIC RANK
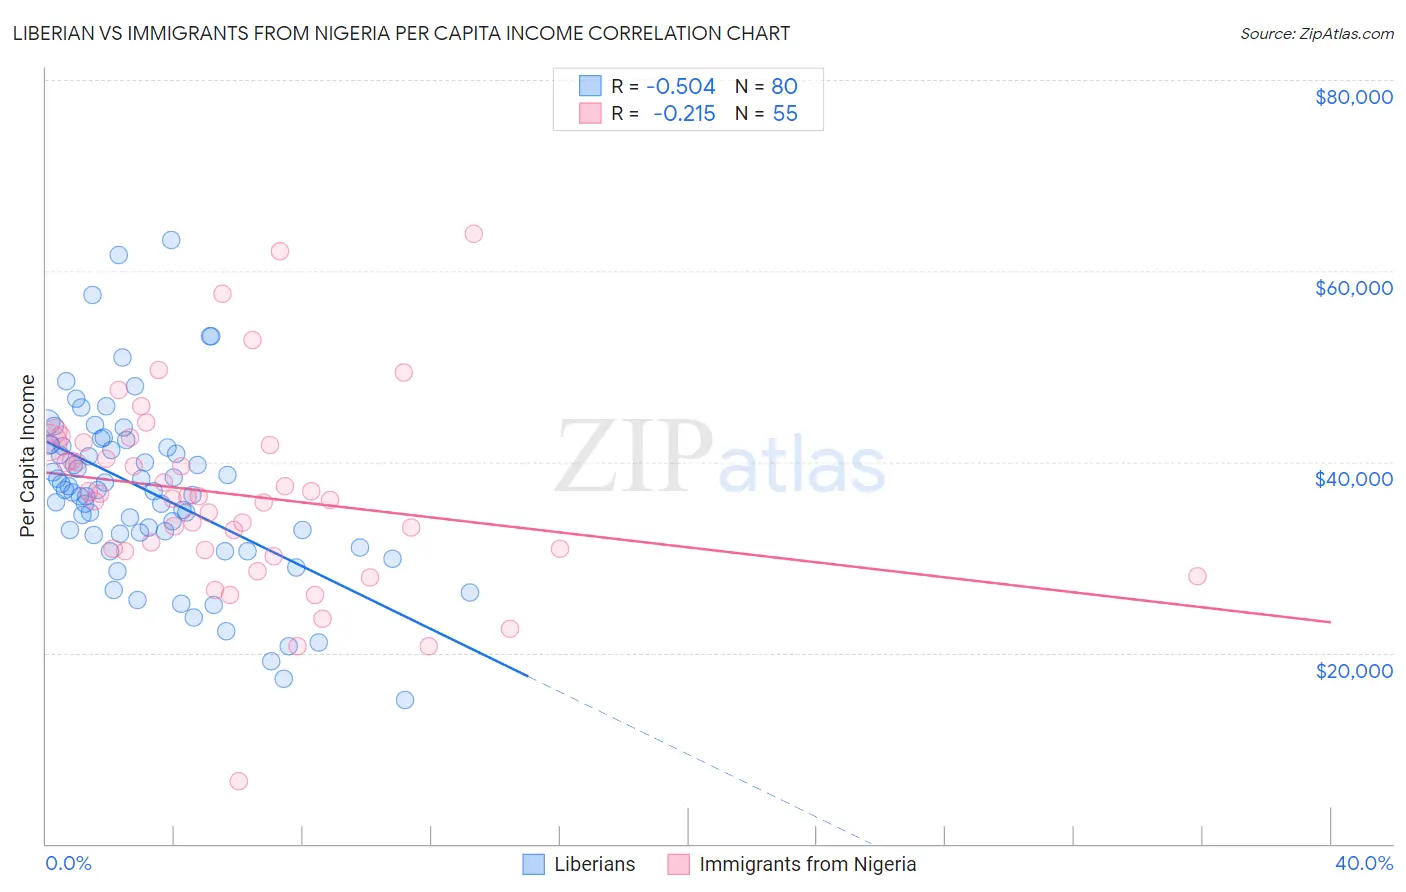
Liberian vs Immigrants from Nigeria Per Capita Income Correlation Chart
The statistical analysis conducted on geographies consisting of 118,107,140 people shows a substantial negative correlation between the proportion of Liberians and per capita income in the United States with a correlation coefficient (R) of -0.504 and weighted average of $38,780. Similarly, the statistical analysis conducted on geographies consisting of 283,501,932 people shows a weak negative correlation between the proportion of Immigrants from Nigeria and per capita income in the United States with a correlation coefficient (R) of -0.215 and weighted average of $40,339, a difference of 4.0%.
Per Capita Income Correlation Summary
| Measurement | Liberian | Immigrants from Nigeria |
| Minimum | $15,041 | $6,524 |
| Maximum | $63,224 | $63,917 |
| Range | $48,183 | $57,393 |
| Mean | $36,863 | $36,581 |
| Median | $37,001 | $36,394 |
| Interquartile 25% (IQ1) | $32,406 | $30,744 |
| Interquartile 75% (IQ3) | $41,709 | $42,001 |
| Interquartile Range (IQR) | $9,304 | $11,256 |
| Standard Deviation (Sample) | $9,178 | $10,124 |
| Standard Deviation (Population) | $9,120 | $10,032 |
Similar Demographics by Per Capita Income
Demographics Similar to Liberians by Per Capita Income
In terms of per capita income, the demographic groups most similar to Liberians are Immigrants from Jamaica ($38,766, a difference of 0.040%), Immigrants from Zaire ($38,848, a difference of 0.17%), Salvadoran ($38,858, a difference of 0.20%), Immigrants from Belize ($38,614, a difference of 0.43%), and Central American ($38,560, a difference of 0.57%).
| Demographics | Rating | Rank | Per Capita Income |
| Marshallese | 0.6 /100 | #261 | Tragic $39,108 |
| Iroquois | 0.6 /100 | #262 | Tragic $39,104 |
| Belizeans | 0.6 /100 | #263 | Tragic $39,097 |
| Americans | 0.6 /100 | #264 | Tragic $39,039 |
| Spanish Americans | 0.5 /100 | #265 | Tragic $39,012 |
| Salvadorans | 0.5 /100 | #266 | Tragic $38,858 |
| Immigrants | Zaire | 0.4 /100 | #267 | Tragic $38,848 |
| Liberians | 0.4 /100 | #268 | Tragic $38,780 |
| Immigrants | Jamaica | 0.4 /100 | #269 | Tragic $38,766 |
| Immigrants | Belize | 0.3 /100 | #270 | Tragic $38,614 |
| Central Americans | 0.3 /100 | #271 | Tragic $38,560 |
| Immigrants | Cabo Verde | 0.3 /100 | #272 | Tragic $38,540 |
| Nepalese | 0.3 /100 | #273 | Tragic $38,442 |
| Immigrants | El Salvador | 0.3 /100 | #274 | Tragic $38,394 |
| Immigrants | Liberia | 0.2 /100 | #275 | Tragic $38,165 |
Demographics Similar to Immigrants from Nigeria by Per Capita Income
In terms of per capita income, the demographic groups most similar to Immigrants from Nigeria are Tsimshian ($40,344, a difference of 0.010%), British West Indian ($40,330, a difference of 0.020%), Somali ($40,367, a difference of 0.070%), Immigrants from Western Africa ($40,294, a difference of 0.11%), and German Russian ($40,266, a difference of 0.18%).
| Demographics | Rating | Rank | Per Capita Income |
| Delaware | 3.8 /100 | #233 | Tragic $40,778 |
| Immigrants | West Indies | 3.7 /100 | #234 | Tragic $40,763 |
| Immigrants | Guyana | 3.6 /100 | #235 | Tragic $40,742 |
| Immigrants | Nonimmigrants | 3.4 /100 | #236 | Tragic $40,669 |
| Immigrants | Cambodia | 2.6 /100 | #237 | Tragic $40,434 |
| Somalis | 2.4 /100 | #238 | Tragic $40,367 |
| Tsimshian | 2.4 /100 | #239 | Tragic $40,344 |
| Immigrants | Nigeria | 2.3 /100 | #240 | Tragic $40,339 |
| British West Indians | 2.3 /100 | #241 | Tragic $40,330 |
| Immigrants | Western Africa | 2.2 /100 | #242 | Tragic $40,294 |
| German Russians | 2.2 /100 | #243 | Tragic $40,266 |
| French American Indians | 2.1 /100 | #244 | Tragic $40,244 |
| Sub-Saharan Africans | 1.9 /100 | #245 | Tragic $40,152 |
| Cree | 1.7 /100 | #246 | Tragic $40,056 |
| Immigrants | Somalia | 1.6 /100 | #247 | Tragic $39,974 |