Immigrants from Eritrea vs Immigrants from Colombia Householder Income Ages 45 - 64 years
COMPARE
Immigrants from Eritrea
Immigrants from Colombia
Householder Income Ages 45 - 64 years
Householder Income Ages 45 - 64 years Comparison
Immigrants from Eritrea
Immigrants from Colombia
$97,373
HOUSEHOLDER INCOME AGES 45 - 64 YEARS
18.6/ 100
METRIC RATING
204th/ 347
METRIC RANK
$97,290
HOUSEHOLDER INCOME AGES 45 - 64 YEARS
18.0/ 100
METRIC RATING
205th/ 347
METRIC RANK
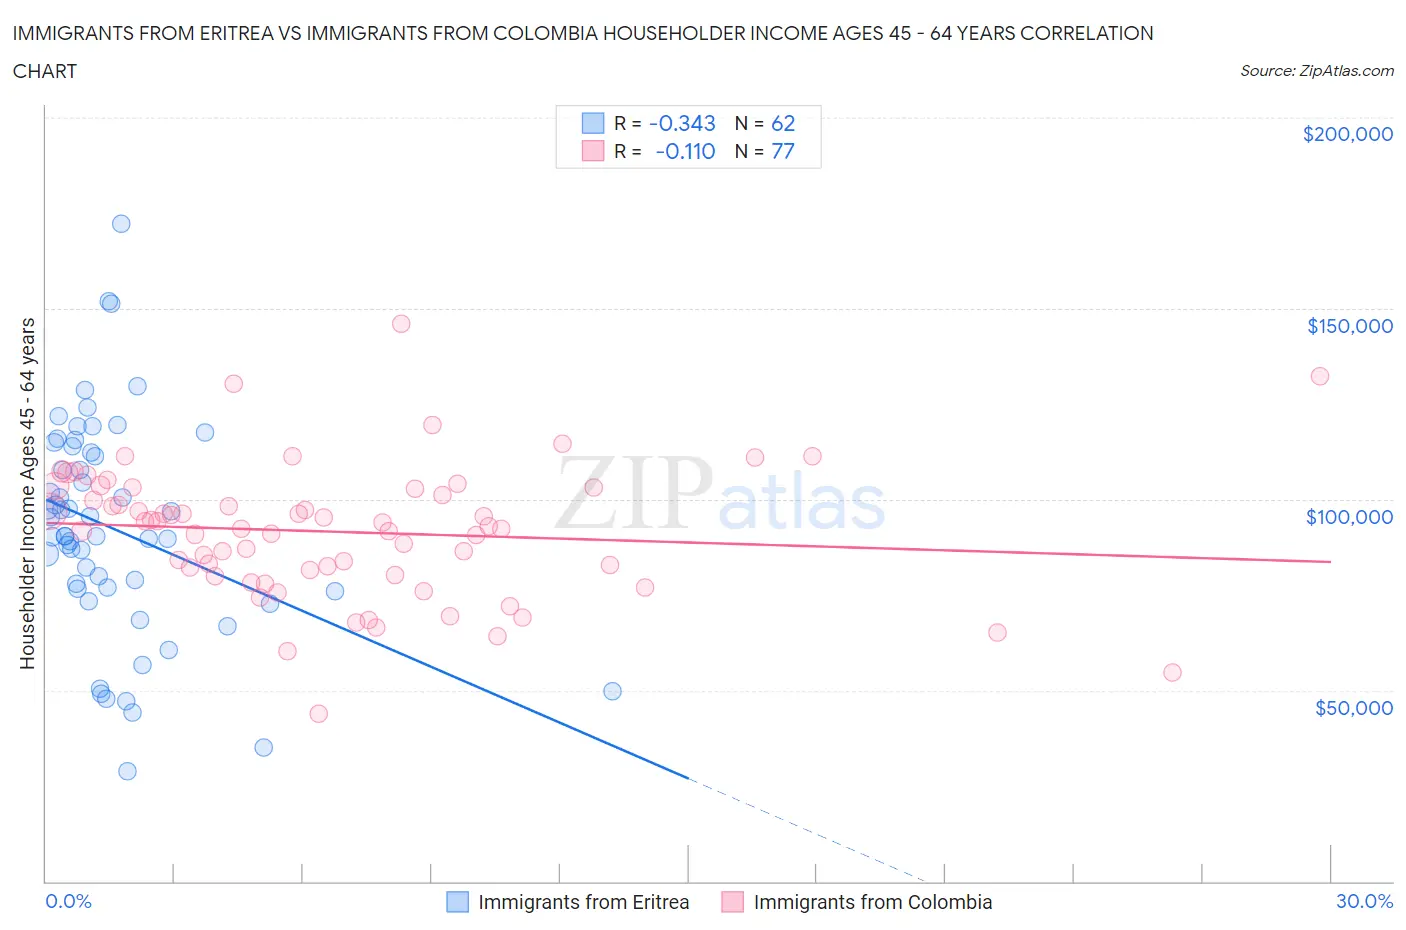
Immigrants from Eritrea vs Immigrants from Colombia Householder Income Ages 45 - 64 years Correlation Chart
The statistical analysis conducted on geographies consisting of 104,839,257 people shows a mild negative correlation between the proportion of Immigrants from Eritrea and household income with householder between the ages 45 and 64 in the United States with a correlation coefficient (R) of -0.343 and weighted average of $97,373. Similarly, the statistical analysis conducted on geographies consisting of 378,202,708 people shows a poor negative correlation between the proportion of Immigrants from Colombia and household income with householder between the ages 45 and 64 in the United States with a correlation coefficient (R) of -0.110 and weighted average of $97,290, a difference of 0.090%.
Householder Income Ages 45 - 64 years Correlation Summary
| Measurement | Immigrants from Eritrea | Immigrants from Colombia |
| Minimum | $28,839 | $43,836 |
| Maximum | $172,216 | $145,834 |
| Range | $143,377 | $101,997 |
| Mean | $92,178 | $91,511 |
| Median | $90,363 | $92,961 |
| Interquartile 25% (IQ1) | $76,571 | $80,871 |
| Interquartile 75% (IQ3) | $112,271 | $102,915 |
| Interquartile Range (IQR) | $35,701 | $22,044 |
| Standard Deviation (Sample) | $28,505 | $17,364 |
| Standard Deviation (Population) | $28,274 | $17,251 |
Demographics Similar to Immigrants from Eritrea and Immigrants from Colombia by Householder Income Ages 45 - 64 years
In terms of householder income ages 45 - 64 years, the demographic groups most similar to Immigrants from Eritrea are Immigrants from Thailand ($97,400, a difference of 0.030%), Tlingit-Haida ($97,417, a difference of 0.040%), Immigrants from Africa ($97,284, a difference of 0.090%), Ghanaian ($97,277, a difference of 0.10%), and Yugoslavian ($97,558, a difference of 0.19%). Similarly, the demographic groups most similar to Immigrants from Colombia are Immigrants from Africa ($97,284, a difference of 0.010%), Ghanaian ($97,277, a difference of 0.010%), Immigrants from Thailand ($97,400, a difference of 0.11%), Tlingit-Haida ($97,417, a difference of 0.13%), and Scotch-Irish ($97,073, a difference of 0.22%).
| Demographics | Rating | Rank | Householder Income Ages 45 - 64 years |
| Uruguayans | 30.3 /100 | #194 | Fair $98,660 |
| Spanish | 29.2 /100 | #195 | Fair $98,554 |
| Immigrants | Eastern Africa | 28.3 /100 | #196 | Fair $98,467 |
| Puget Sound Salish | 27.0 /100 | #197 | Fair $98,340 |
| Immigrants | Iraq | 25.7 /100 | #198 | Fair $98,201 |
| Whites/Caucasians | 24.6 /100 | #199 | Fair $98,091 |
| Immigrants | Kenya | 23.5 /100 | #200 | Fair $97,964 |
| Yugoslavians | 20.0 /100 | #201 | Fair $97,558 |
| Tlingit-Haida | 18.9 /100 | #202 | Poor $97,417 |
| Immigrants | Thailand | 18.8 /100 | #203 | Poor $97,400 |
| Immigrants | Eritrea | 18.6 /100 | #204 | Poor $97,373 |
| Immigrants | Colombia | 18.0 /100 | #205 | Poor $97,290 |
| Immigrants | Africa | 17.9 /100 | #206 | Poor $97,284 |
| Ghanaians | 17.9 /100 | #207 | Poor $97,277 |
| Scotch-Irish | 16.4 /100 | #208 | Poor $97,073 |
| Japanese | 14.8 /100 | #209 | Poor $96,834 |
| Tsimshian | 14.5 /100 | #210 | Poor $96,783 |
| Immigrants | Cambodia | 13.0 /100 | #211 | Poor $96,537 |
| Venezuelans | 12.6 /100 | #212 | Poor $96,460 |
| Immigrants | Uruguay | 10.7 /100 | #213 | Poor $96,086 |
| Panamanians | 10.6 /100 | #214 | Poor $96,066 |