Ute vs Czech Divorced or Separated
COMPARE
Ute
Czech
Divorced or Separated
Divorced or Separated Comparison
Ute
Czechs
12.6%
DIVORCED OR SEPARATED
0.4/ 100
METRIC RATING
270th/ 347
METRIC RANK
11.9%
DIVORCED OR SEPARATED
76.4/ 100
METRIC RATING
151st/ 347
METRIC RANK
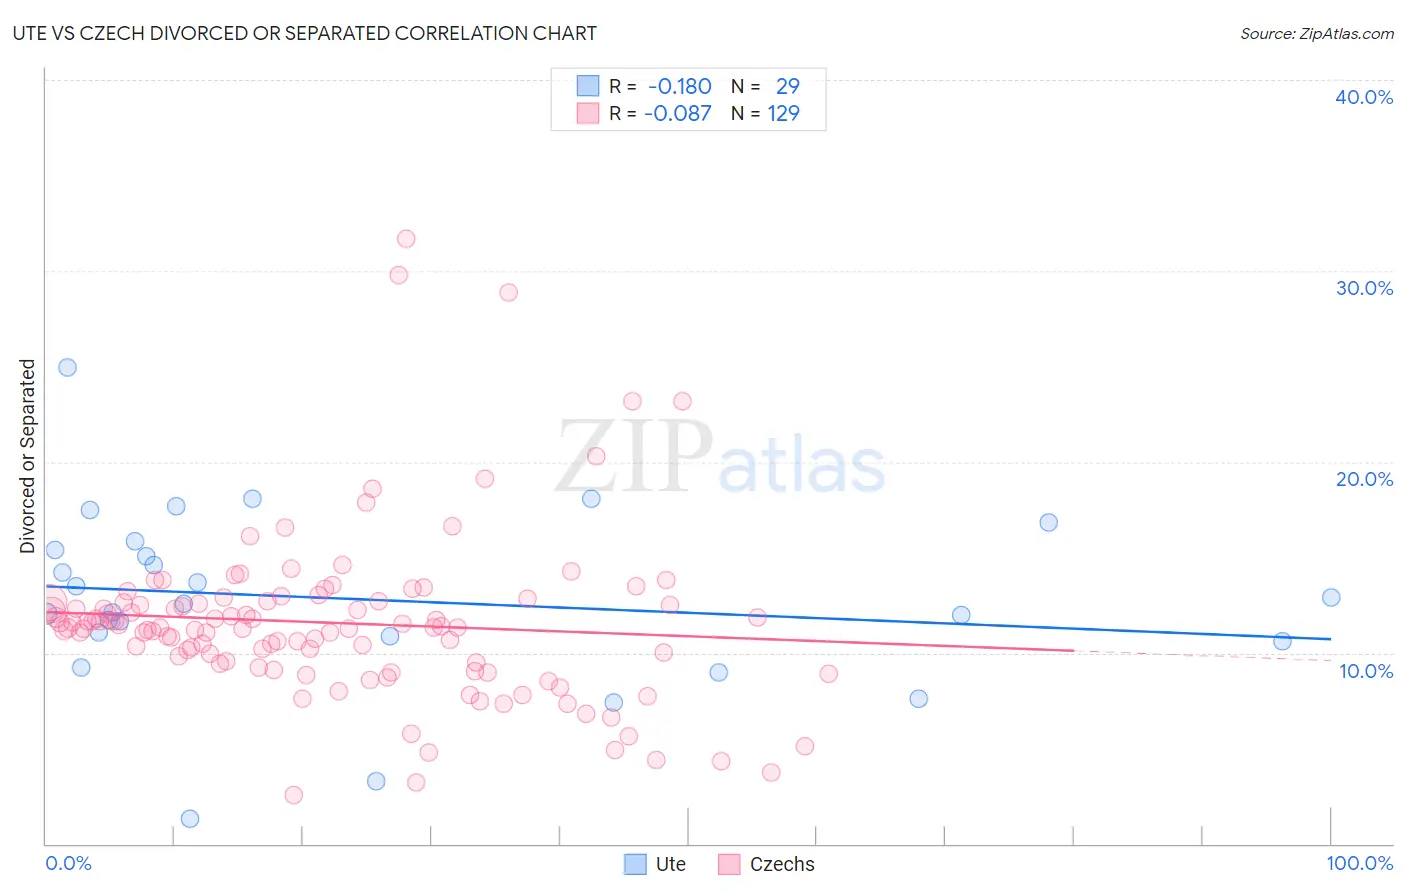
Ute vs Czech Divorced or Separated Correlation Chart
The statistical analysis conducted on geographies consisting of 55,667,313 people shows a poor negative correlation between the proportion of Ute and percentage of population currently divorced or separated in the United States with a correlation coefficient (R) of -0.180 and weighted average of 12.6%. Similarly, the statistical analysis conducted on geographies consisting of 484,565,083 people shows a slight negative correlation between the proportion of Czechs and percentage of population currently divorced or separated in the United States with a correlation coefficient (R) of -0.087 and weighted average of 11.9%, a difference of 5.9%.
Divorced or Separated Correlation Summary
| Measurement | Ute | Czech |
| Minimum | 1.3% | 2.5% |
| Maximum | 24.9% | 31.7% |
| Range | 23.6% | 29.2% |
| Mean | 12.8% | 11.6% |
| Median | 12.6% | 11.3% |
| Interquartile 25% (IQ1) | 10.7% | 9.5% |
| Interquartile 75% (IQ3) | 15.6% | 12.7% |
| Interquartile Range (IQR) | 4.9% | 3.2% |
| Standard Deviation (Sample) | 4.7% | 4.4% |
| Standard Deviation (Population) | 4.6% | 4.4% |
Similar Demographics by Divorced or Separated
Demographics Similar to Ute by Divorced or Separated
In terms of divorced or separated, the demographic groups most similar to Ute are Panamanian (12.7%, a difference of 0.060%), Immigrants from Middle Africa (12.7%, a difference of 0.11%), Immigrants from Liberia (12.6%, a difference of 0.12%), Fijian (12.6%, a difference of 0.13%), and Scottish (12.6%, a difference of 0.14%).
| Demographics | Rating | Rank | Divorced or Separated |
| Immigrants | Panama | 0.5 /100 | #263 | Tragic 12.6% |
| English | 0.5 /100 | #264 | Tragic 12.6% |
| Immigrants | Senegal | 0.5 /100 | #265 | Tragic 12.6% |
| Whites/Caucasians | 0.5 /100 | #266 | Tragic 12.6% |
| Scottish | 0.4 /100 | #267 | Tragic 12.6% |
| Fijians | 0.4 /100 | #268 | Tragic 12.6% |
| Immigrants | Liberia | 0.4 /100 | #269 | Tragic 12.6% |
| Ute | 0.4 /100 | #270 | Tragic 12.6% |
| Panamanians | 0.3 /100 | #271 | Tragic 12.7% |
| Immigrants | Middle Africa | 0.3 /100 | #272 | Tragic 12.7% |
| Immigrants | Micronesia | 0.3 /100 | #273 | Tragic 12.7% |
| Bermudans | 0.3 /100 | #274 | Tragic 12.7% |
| Central American Indians | 0.3 /100 | #275 | Tragic 12.7% |
| Spaniards | 0.2 /100 | #276 | Tragic 12.7% |
| Dominicans | 0.2 /100 | #277 | Tragic 12.7% |
Demographics Similar to Czechs by Divorced or Separated
In terms of divorced or separated, the demographic groups most similar to Czechs are Immigrants from Portugal (11.9%, a difference of 0.040%), Immigrants from Oceania (11.9%, a difference of 0.060%), Italian (11.9%, a difference of 0.070%), Polish (11.9%, a difference of 0.11%), and Immigrants from Hungary (11.9%, a difference of 0.13%).
| Demographics | Rating | Rank | Divorced or Separated |
| Peruvians | 80.9 /100 | #144 | Excellent 11.9% |
| Croatians | 80.6 /100 | #145 | Excellent 11.9% |
| Immigrants | Grenada | 79.1 /100 | #146 | Good 11.9% |
| Poles | 78.6 /100 | #147 | Good 11.9% |
| Italians | 77.8 /100 | #148 | Good 11.9% |
| Immigrants | Oceania | 77.7 /100 | #149 | Good 11.9% |
| Immigrants | Portugal | 77.3 /100 | #150 | Good 11.9% |
| Czechs | 76.4 /100 | #151 | Good 11.9% |
| Immigrants | Hungary | 73.7 /100 | #152 | Good 11.9% |
| Austrians | 72.2 /100 | #153 | Good 12.0% |
| Chileans | 71.3 /100 | #154 | Good 12.0% |
| Japanese | 70.9 /100 | #155 | Good 12.0% |
| Hungarians | 70.3 /100 | #156 | Good 12.0% |
| Immigrants | Brazil | 68.8 /100 | #157 | Good 12.0% |
| Icelanders | 66.0 /100 | #158 | Good 12.0% |