U.S. Virgin Islander vs Celtic Median Female Earnings
COMPARE
U.S. Virgin Islander
Celtic
Median Female Earnings
Median Female Earnings Comparison
U.S. Virgin Islanders
Celtics
$36,424
MEDIAN FEMALE EARNINGS
0.1/ 100
METRIC RATING
278th/ 347
METRIC RANK
$38,283
MEDIAN FEMALE EARNINGS
5.0/ 100
METRIC RATING
234th/ 347
METRIC RANK
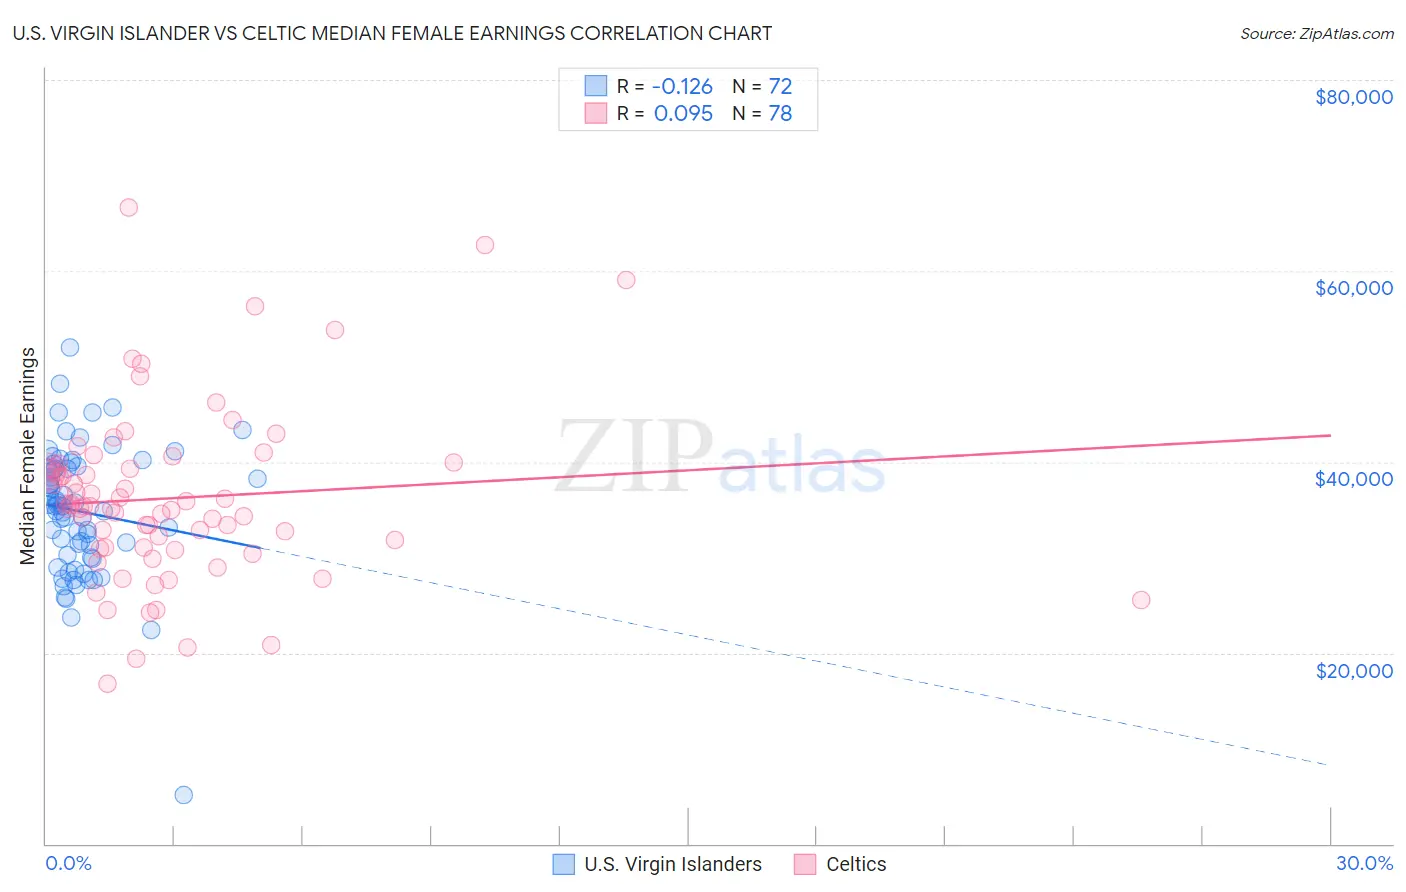
U.S. Virgin Islander vs Celtic Median Female Earnings Correlation Chart
The statistical analysis conducted on geographies consisting of 87,518,973 people shows a poor negative correlation between the proportion of U.S. Virgin Islanders and median female earnings in the United States with a correlation coefficient (R) of -0.126 and weighted average of $36,424. Similarly, the statistical analysis conducted on geographies consisting of 168,839,546 people shows a slight positive correlation between the proportion of Celtics and median female earnings in the United States with a correlation coefficient (R) of 0.095 and weighted average of $38,283, a difference of 5.1%.
Median Female Earnings Correlation Summary
| Measurement | U.S. Virgin Islander | Celtic |
| Minimum | $5,057 | $16,819 |
| Maximum | $51,985 | $66,675 |
| Range | $46,928 | $49,856 |
| Mean | $34,778 | $36,202 |
| Median | $35,393 | $35,368 |
| Interquartile 25% (IQ1) | $30,098 | $30,981 |
| Interquartile 75% (IQ3) | $39,427 | $39,367 |
| Interquartile Range (IQR) | $9,329 | $8,386 |
| Standard Deviation (Sample) | $6,997 | $9,110 |
| Standard Deviation (Population) | $6,948 | $9,052 |
Similar Demographics by Median Female Earnings
Demographics Similar to U.S. Virgin Islanders by Median Female Earnings
In terms of median female earnings, the demographic groups most similar to U.S. Virgin Islanders are Immigrants from Caribbean ($36,414, a difference of 0.030%), Iroquois ($36,408, a difference of 0.050%), Spanish American ($36,391, a difference of 0.090%), Marshallese ($36,459, a difference of 0.10%), and Haitian ($36,374, a difference of 0.14%).
| Demographics | Rating | Rank | Median Female Earnings |
| Nicaraguans | 0.3 /100 | #271 | Tragic $36,904 |
| Immigrants | Dominican Republic | 0.3 /100 | #272 | Tragic $36,857 |
| Immigrants | Laos | 0.3 /100 | #273 | Tragic $36,841 |
| Immigrants | El Salvador | 0.2 /100 | #274 | Tragic $36,673 |
| Africans | 0.1 /100 | #275 | Tragic $36,530 |
| Central Americans | 0.1 /100 | #276 | Tragic $36,492 |
| Marshallese | 0.1 /100 | #277 | Tragic $36,459 |
| U.S. Virgin Islanders | 0.1 /100 | #278 | Tragic $36,424 |
| Immigrants | Caribbean | 0.1 /100 | #279 | Tragic $36,414 |
| Iroquois | 0.1 /100 | #280 | Tragic $36,408 |
| Spanish Americans | 0.1 /100 | #281 | Tragic $36,391 |
| Haitians | 0.1 /100 | #282 | Tragic $36,374 |
| Immigrants | Haiti | 0.1 /100 | #283 | Tragic $36,203 |
| Indonesians | 0.1 /100 | #284 | Tragic $36,140 |
| Paiute | 0.1 /100 | #285 | Tragic $36,056 |
Demographics Similar to Celtics by Median Female Earnings
In terms of median female earnings, the demographic groups most similar to Celtics are Tongan ($38,288, a difference of 0.010%), Scandinavian ($38,306, a difference of 0.060%), Somali ($38,333, a difference of 0.13%), Basque ($38,352, a difference of 0.18%), and Sudanese ($38,215, a difference of 0.18%).
| Demographics | Rating | Rank | Median Female Earnings |
| Scottish | 6.3 /100 | #227 | Tragic $38,397 |
| Sub-Saharan Africans | 6.2 /100 | #228 | Tragic $38,391 |
| Belgians | 6.1 /100 | #229 | Tragic $38,382 |
| Basques | 5.7 /100 | #230 | Tragic $38,352 |
| Somalis | 5.5 /100 | #231 | Tragic $38,333 |
| Scandinavians | 5.2 /100 | #232 | Tragic $38,306 |
| Tongans | 5.1 /100 | #233 | Tragic $38,288 |
| Celtics | 5.0 /100 | #234 | Tragic $38,283 |
| Sudanese | 4.4 /100 | #235 | Tragic $38,215 |
| Liberians | 4.4 /100 | #236 | Tragic $38,215 |
| Immigrants | Cabo Verde | 4.3 /100 | #237 | Tragic $38,208 |
| Alaska Natives | 4.3 /100 | #238 | Tragic $38,202 |
| English | 4.2 /100 | #239 | Tragic $38,196 |
| Finns | 4.0 /100 | #240 | Tragic $38,173 |
| Spanish | 3.5 /100 | #241 | Tragic $38,098 |