Uruguayan vs Marshallese Per Capita Income
COMPARE
Uruguayan
Marshallese
Per Capita Income
Per Capita Income Comparison
Uruguayans
Marshallese
$44,318
PER CAPITA INCOME
67.6/ 100
METRIC RATING
155th/ 347
METRIC RANK
$39,108
PER CAPITA INCOME
0.6/ 100
METRIC RATING
261st/ 347
METRIC RANK
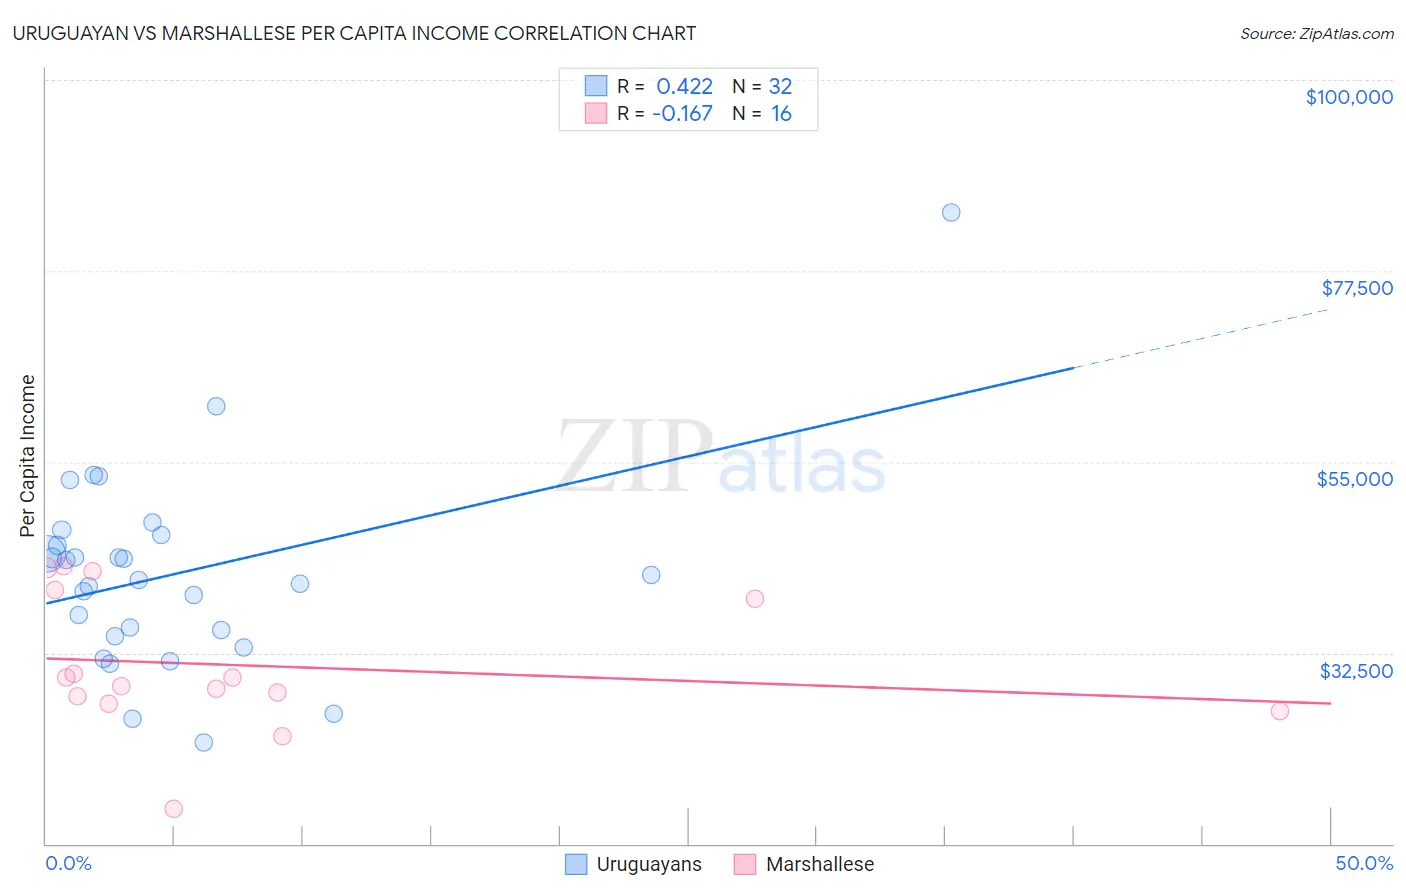
Uruguayan vs Marshallese Per Capita Income Correlation Chart
The statistical analysis conducted on geographies consisting of 144,785,218 people shows a moderate positive correlation between the proportion of Uruguayans and per capita income in the United States with a correlation coefficient (R) of 0.422 and weighted average of $44,318. Similarly, the statistical analysis conducted on geographies consisting of 14,761,315 people shows a poor negative correlation between the proportion of Marshallese and per capita income in the United States with a correlation coefficient (R) of -0.167 and weighted average of $39,108, a difference of 13.3%.
Per Capita Income Correlation Summary
| Measurement | Uruguayan | Marshallese |
| Minimum | $21,859 | $14,082 |
| Maximum | $84,313 | $42,763 |
| Range | $62,454 | $28,681 |
| Mean | $41,831 | $31,016 |
| Median | $41,436 | $29,047 |
| Interquartile 25% (IQ1) | $34,824 | $26,970 |
| Interquartile 75% (IQ3) | $45,774 | $39,382 |
| Interquartile Range (IQR) | $10,950 | $12,413 |
| Standard Deviation (Sample) | $11,692 | $8,089 |
| Standard Deviation (Population) | $11,508 | $7,833 |
Similar Demographics by Per Capita Income
Demographics Similar to Uruguayans by Per Capita Income
In terms of per capita income, the demographic groups most similar to Uruguayans are Portuguese ($44,362, a difference of 0.10%), Slovak ($44,229, a difference of 0.20%), South American Indian ($44,206, a difference of 0.25%), Scottish ($44,440, a difference of 0.27%), and Immigrants from Nepal ($44,187, a difference of 0.30%).
| Demographics | Rating | Rank | Per Capita Income |
| Immigrants | Armenia | 73.1 /100 | #148 | Good $44,552 |
| Koreans | 72.5 /100 | #149 | Good $44,522 |
| Immigrants | Eritrea | 72.1 /100 | #150 | Good $44,509 |
| Norwegians | 71.5 /100 | #151 | Good $44,480 |
| Peruvians | 71.5 /100 | #152 | Good $44,479 |
| Scottish | 70.6 /100 | #153 | Good $44,440 |
| Portuguese | 68.7 /100 | #154 | Good $44,362 |
| Uruguayans | 67.6 /100 | #155 | Good $44,318 |
| Slovaks | 65.4 /100 | #156 | Good $44,229 |
| South American Indians | 64.8 /100 | #157 | Good $44,206 |
| Immigrants | Nepal | 64.3 /100 | #158 | Good $44,187 |
| South Americans | 62.4 /100 | #159 | Good $44,114 |
| Danes | 61.9 /100 | #160 | Good $44,095 |
| Costa Ricans | 61.8 /100 | #161 | Good $44,090 |
| Swiss | 61.4 /100 | #162 | Good $44,076 |
Demographics Similar to Marshallese by Per Capita Income
In terms of per capita income, the demographic groups most similar to Marshallese are Iroquois ($39,104, a difference of 0.010%), Belizean ($39,097, a difference of 0.030%), Alaskan Athabascan ($39,163, a difference of 0.14%), American ($39,039, a difference of 0.17%), and Malaysian ($39,194, a difference of 0.22%).
| Demographics | Rating | Rank | Per Capita Income |
| Alaska Natives | 1.0 /100 | #254 | Tragic $39,558 |
| Immigrants | Middle Africa | 1.0 /100 | #255 | Tragic $39,529 |
| Hawaiians | 0.8 /100 | #256 | Tragic $39,403 |
| Nicaraguans | 0.8 /100 | #257 | Tragic $39,372 |
| Jamaicans | 0.7 /100 | #258 | Tragic $39,231 |
| Malaysians | 0.7 /100 | #259 | Tragic $39,194 |
| Alaskan Athabascans | 0.6 /100 | #260 | Tragic $39,163 |
| Marshallese | 0.6 /100 | #261 | Tragic $39,108 |
| Iroquois | 0.6 /100 | #262 | Tragic $39,104 |
| Belizeans | 0.6 /100 | #263 | Tragic $39,097 |
| Americans | 0.6 /100 | #264 | Tragic $39,039 |
| Spanish Americans | 0.5 /100 | #265 | Tragic $39,012 |
| Salvadorans | 0.5 /100 | #266 | Tragic $38,858 |
| Immigrants | Zaire | 0.4 /100 | #267 | Tragic $38,848 |
| Liberians | 0.4 /100 | #268 | Tragic $38,780 |